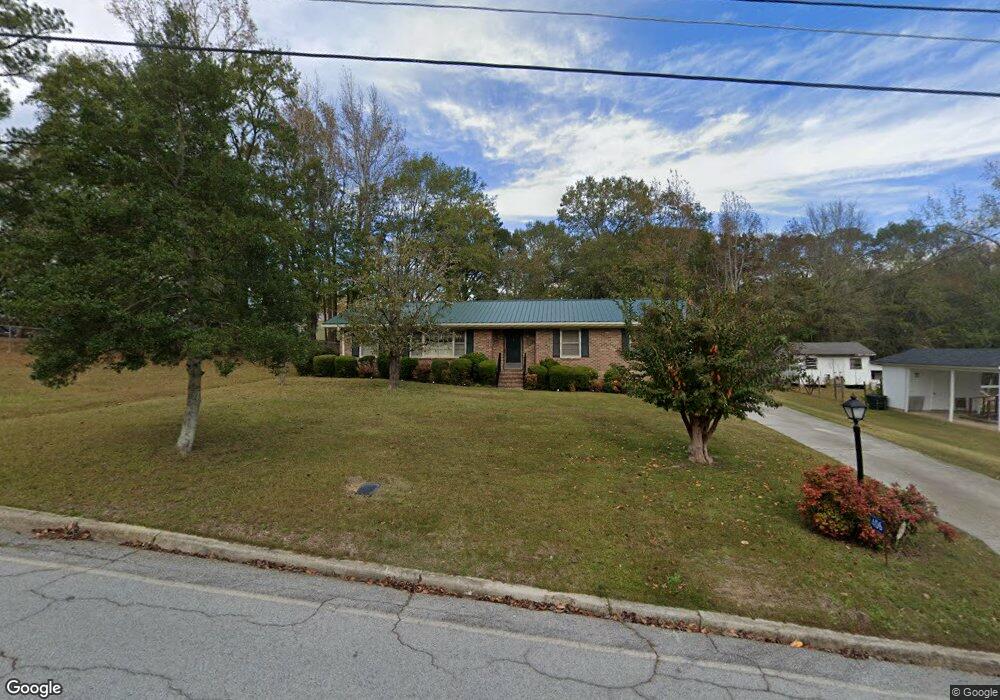
406 Ridgecrest Dr Elberton, GA 30635
Estimated Value: $185,000 - $232,000
3
Beds
2
Baths
1,636
Sq Ft
$122/Sq Ft
Est. Value
About This Home
This home is located at 406 Ridgecrest Dr, Elberton, GA 30635 and is currently estimated at $199,920, approximately $122 per square foot. 406 Ridgecrest Dr is a home located in Elbert County with nearby schools including Elbert County Elementary School, Elbert County Primary School, and Elbert County Middle School.
Ownership History
Date
Name
Owned For
Owner Type
Purchase Details
Closed on
Dec 8, 2016
Sold by
Cobo Jimmie M and Cobo Michael M
Bought by
Heard Rose Melba
Current Estimated Value
Home Financials for this Owner
Home Financials are based on the most recent Mortgage that was taken out on this home.
Original Mortgage
$86,868
Outstanding Balance
$70,252
Interest Rate
3.57%
Estimated Equity
$129,668
Purchase Details
Closed on
Oct 11, 2016
Sold by
Evita
Bought by
Cobo Michael M
Home Financials for this Owner
Home Financials are based on the most recent Mortgage that was taken out on this home.
Original Mortgage
$86,868
Outstanding Balance
$70,252
Interest Rate
3.57%
Estimated Equity
$129,668
Purchase Details
Closed on
Oct 30, 2014
Sold by
Cobo Jimmie M
Bought by
Cobo Evita and Cobo Michael M
Purchase Details
Closed on
Jun 1, 1965
Sold by
Cobo Louis Mrs
Bought by
Cobo Louis
Purchase Details
Closed on
Jan 1, 1956
Create a Home Valuation Report for This Property
The Home Valuation Report is an in-depth analysis detailing your home's value as well as a comparison with similar homes in the area
Home Values in the Area
Average Home Value in this Area
Purchase History
| Date | Buyer | Sale Price | Title Company |
|---|---|---|---|
| Heard Rose Melba | $86,000 | -- | |
| Cobo Michael M | -- | -- | |
| Cobo Evita | -- | -- | |
| Cobo Louis | -- | -- | |
| -- | $1,100 | -- |
Source: Public Records
Mortgage History
| Date | Status | Borrower | Loan Amount |
|---|---|---|---|
| Open | Heard Rose Melba | $86,868 |
Source: Public Records
Tax History Compared to Growth
Tax History
| Year | Tax Paid | Tax Assessment Tax Assessment Total Assessment is a certain percentage of the fair market value that is determined by local assessors to be the total taxable value of land and additions on the property. | Land | Improvement |
|---|---|---|---|---|
| 2024 | $1,631 | $71,745 | $4,735 | $67,010 |
| 2023 | $1,631 | $71,745 | $4,735 | $67,010 |
| 2022 | $1,070 | $48,852 | $4,735 | $44,117 |
| 2021 | $1,077 | $48,852 | $4,735 | $44,117 |
| 2020 | $863 | $36,683 | $4,735 | $31,948 |
| 2019 | $887 | $36,683 | $4,735 | $31,948 |
| 2018 | $1,009 | $36,683 | $4,735 | $31,948 |
| 2017 | $1,009 | $34,130 | $4,735 | $29,395 |
| 2016 | $701 | $33,895 | $4,735 | $29,160 |
| 2015 | -- | $33,895 | $4,735 | $29,160 |
| 2014 | -- | $33,895 | $4,735 | $29,160 |
| 2013 | -- | $33,690 | $4,735 | $28,955 |
Source: Public Records
Map
Nearby Homes
- 170 Lake Forest Dr
- 136 Forest Ave
- 381 College Ave
- 270 Dogwood Ln
- 143 Lake Forest Cir
- 0 Pulliam St Unit 7659662
- 0 Pulliam St Unit 10616872
- 89 College Ave
- 108 Brookhaven Cir
- 62 Oak St
- 118 Oak Dr
- 243 W Tate St
- 0 Oak Dr Unit 7643600
- 0 Oak Dr Unit 10598083
- 0 Rhodes Dr Unit 10455518
- 2790 Cedar Creek Rd
- 196 S Oliver St
- 968 Ext Elbert St
- 345 N Oliver St
- 105 S Thomas St
- 404 Ridgecrest Dr
- 555 Jones St
- 547 Jones St
- 559 Jones St
- 545 Jones St
- 405 Ridgecrest Dr
- 410 Ridgecrest Dr
- 543 Jones St
- 403 Ridgecrest Dr
- 233 Brookwood Cir
- 407 Ridgecrest Dr
- 550 Jones St
- 554 Jones St
- 135 Brookwood Cir
- 540 Jones St
- 238 Lake Forest Dr
- 234 Lake Forest Dr
- 556 Jones St
- 228 Lake Forest Dr
- 0 Ridgecrest Dr Unit 7380752