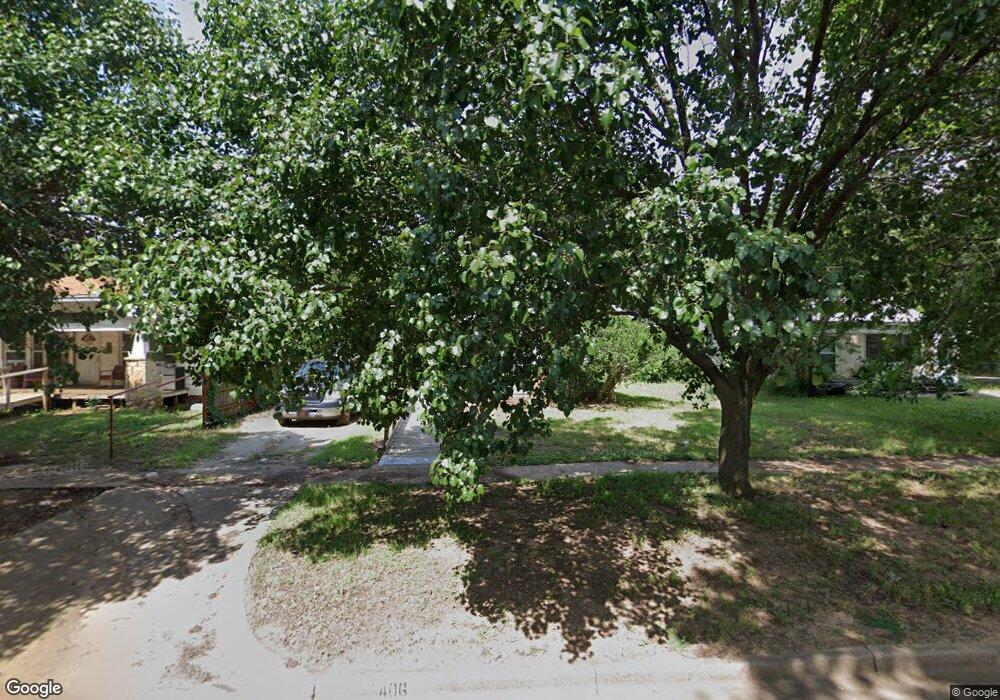
406 S Palm St Ponca City, OK 74601
Estimated Value: $49,000 - $56,000
2
Beds
1
Bath
990
Sq Ft
$52/Sq Ft
Est. Value
About This Home
This home is located at 406 S Palm St, Ponca City, OK 74601 and is currently estimated at $51,194, approximately $51 per square foot. 406 S Palm St is a home located in Kay County with nearby schools including Lincoln Elementary School, Ponca City West Middle School, and Ponca City East Middle School.
Ownership History
Date
Name
Owned For
Owner Type
Purchase Details
Closed on
Aug 17, 2006
Sold by
Bailey Jeff and Bailey Tambra
Bought by
Wolfkill Cindy L
Current Estimated Value
Home Financials for this Owner
Home Financials are based on the most recent Mortgage that was taken out on this home.
Original Mortgage
$24,052
Outstanding Balance
$14,448
Interest Rate
6.77%
Mortgage Type
Purchase Money Mortgage
Estimated Equity
$36,746
Purchase Details
Closed on
May 22, 2002
Sold by
Katherine Mason
Bought by
Tambra Jeff and Tambra Bailey
Create a Home Valuation Report for This Property
The Home Valuation Report is an in-depth analysis detailing your home's value as well as a comparison with similar homes in the area
Home Values in the Area
Average Home Value in this Area
Purchase History
| Date | Buyer | Sale Price | Title Company |
|---|---|---|---|
| Wolfkill Cindy L | $23,000 | -- | |
| Tambra Jeff | $11,500 | -- |
Source: Public Records
Mortgage History
| Date | Status | Borrower | Loan Amount |
|---|---|---|---|
| Open | Wolfkill Cindy L | $24,052 |
Source: Public Records
Tax History Compared to Growth
Tax History
| Year | Tax Paid | Tax Assessment Tax Assessment Total Assessment is a certain percentage of the fair market value that is determined by local assessors to be the total taxable value of land and additions on the property. | Land | Improvement |
|---|---|---|---|---|
| 2024 | $313 | $3,303 | $308 | $2,995 |
| 2023 | $313 | $3,146 | $308 | $2,838 |
| 2022 | $285 | $2,996 | $308 | $2,688 |
| 2021 | $287 | $2,996 | $308 | $2,688 |
| 2020 | $282 | $2,984 | $308 | $2,676 |
| 2019 | $272 | $2,843 | $308 | $2,535 |
| 2018 | $273 | $2,817 | $308 | $2,509 |
| 2017 | $276 | $2,817 | $308 | $2,509 |
| 2016 | $279 | $2,817 | $308 | $2,509 |
| 2015 | $281 | $2,827 | $308 | $2,519 |
| 2014 | $285 | $2,917 | $308 | $2,609 |
Source: Public Records
Map
Nearby Homes