Estimated Value: $707,000 - $890,000
3
Beds
3
Baths
3,833
Sq Ft
$204/Sq Ft
Est. Value
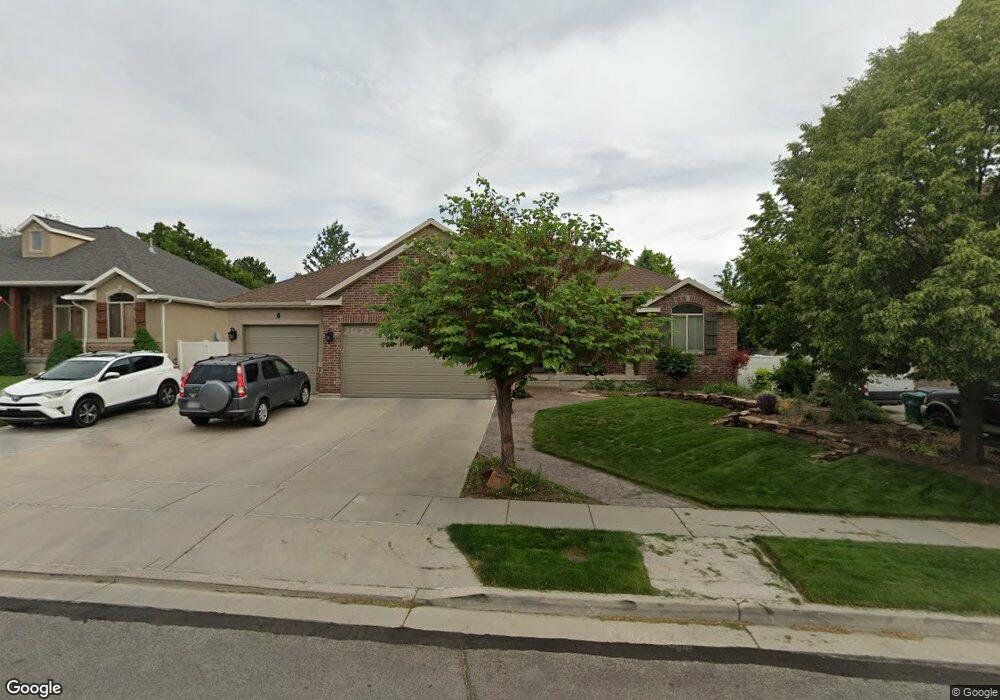
About This Home
This home is located at 406 Sandy Oaks Dr, Sandy, UT 84070 and is currently estimated at $781,778, approximately $203 per square foot. 406 Sandy Oaks Dr is a home located in Salt Lake County with nearby schools including Sandy Elementary School, Mount Jordan Middle School, and Jordan High.
Ownership History
Date
Name
Owned For
Owner Type
Purchase Details
Closed on
Jun 29, 2015
Sold by
Burningham Robyn
Bought by
Burningham Tyler William and Burningham Robyn Leslie
Current Estimated Value
Home Financials for this Owner
Home Financials are based on the most recent Mortgage that was taken out on this home.
Original Mortgage
$217,000
Outstanding Balance
$169,910
Interest Rate
3.98%
Mortgage Type
New Conventional
Estimated Equity
$611,868
Purchase Details
Closed on
Sep 23, 2003
Sold by
Symphony Development Corp
Bought by
Burningham Robyn
Home Financials for this Owner
Home Financials are based on the most recent Mortgage that was taken out on this home.
Original Mortgage
$269,550
Interest Rate
5.5%
Mortgage Type
Purchase Money Mortgage
Purchase Details
Closed on
Sep 3, 2002
Sold by
Premier Land Development Llc
Bought by
Symphony Development Corp
Create a Home Valuation Report for This Property
The Home Valuation Report is an in-depth analysis detailing your home's value as well as a comparison with similar homes in the area
Home Values in the Area
Average Home Value in this Area
Purchase History
We collect this data history from publicly available records. To have your information removed, we recommend requesting removal directly through your county’s website.
| Date | Buyer | Sale Price | Title Company |
|---|---|---|---|
| Burningham Tyler William | -- | Wasatch Title Ins Agency Llc | |
| Burningham Robyn | -- | Surety Title | |
| Symphony Development Corp | -- | Merrill Title |
Source: Public Records
Mortgage History
We collect this data history from publicly available records. To have your information removed, we recommend requesting removal directly through your county’s website.
| Date | Status | Borrower | Loan Amount |
|---|---|---|---|
| Open | Burningham Tyler William | $217,000 | |
| Closed | Burningham Robyn | $269,550 |
Source: Public Records
Tax History
| Year | Tax Paid | Tax Assessment Tax Assessment Total Assessment is a certain percentage of the fair market value that is determined by local assessors to be the total taxable value of land and additions on the property. | Land | Improvement |
|---|---|---|---|---|
| 2025 | $3,641 | $677,600 | $160,100 | $517,500 |
| 2024 | $3,641 | $673,300 | $149,700 | $523,600 |
| 2023 | $3,386 | $624,400 | $142,300 | $482,100 |
| 2022 | $3,502 | $630,800 | $139,500 | $491,300 |
| 2021 | $3,290 | $504,500 | $119,300 | $385,200 |
| 2020 | $3,123 | $451,600 | $119,300 | $332,300 |
| 2019 | $3,104 | $437,400 | $112,500 | $324,900 |
| 2018 | $2,746 | $402,800 | $112,500 | $290,300 |
| 2017 | $2,720 | $381,200 | $112,500 | $268,700 |
| 2016 | $2,662 | $360,700 | $112,500 | $248,200 |
| 2015 | $3,259 | $408,600 | $109,100 | $299,500 |
| 2014 | $3,018 | $370,900 | $100,100 | $270,800 |
Source: Public Records
Map
Nearby Homes
- 359 E 8400 S
- 8327 S Romaine Dr
- 416 E 8260 S
- 8322 S Levine Ln Unit 111
- 8260 S 560 E
- 635 E Williamsburg Park Cir
- 8447 Mayfly Way
- 412 E 8760 S
- 144 E Chambord Ct
- 140 E Chambord Ct
- 138 E Chambord Ct
- 136 E Chambord Ct
- 132 E Chambord Ct
- 8780 S 250 E
- 8732 S 620 E
- 87 Pioneer Ave
- 8831 S 400 E
- 8307 S Durham St
- 8278 S Resaca Dr Unit L-10
- 8278 S Resaca Dr Unit L1
- 396 Sandy Oaks Dr
- 416 E Sandy Oaks Dr
- 416 Sandy Oaks Dr
- 396 E Sandy Oaks Dr
- 413 E 8490 S
- 423 E 8490 S
- 401 E 8490 S
- 386 E Sandy Oaks Dr
- 386 Sandy Oaks Dr
- 426 E Sandy Oaks Dr
- 426 Sandy Oaks Dr
- 407 Sandy Oaks Dr
- 407 E Sandy Oaks Dr
- 397 E Sandy Oaks Dr
- 397 Sandy Oaks Dr
- 433 E 8490 S
- 417 E Sandy Oaks Dr
- 417 Sandy Oaks Dr
- 387 E Sandy Oaks Dr
- 387 Sandy Oaks Dr
Your Personal Tour Guide
Ask me questions while you tour the home.