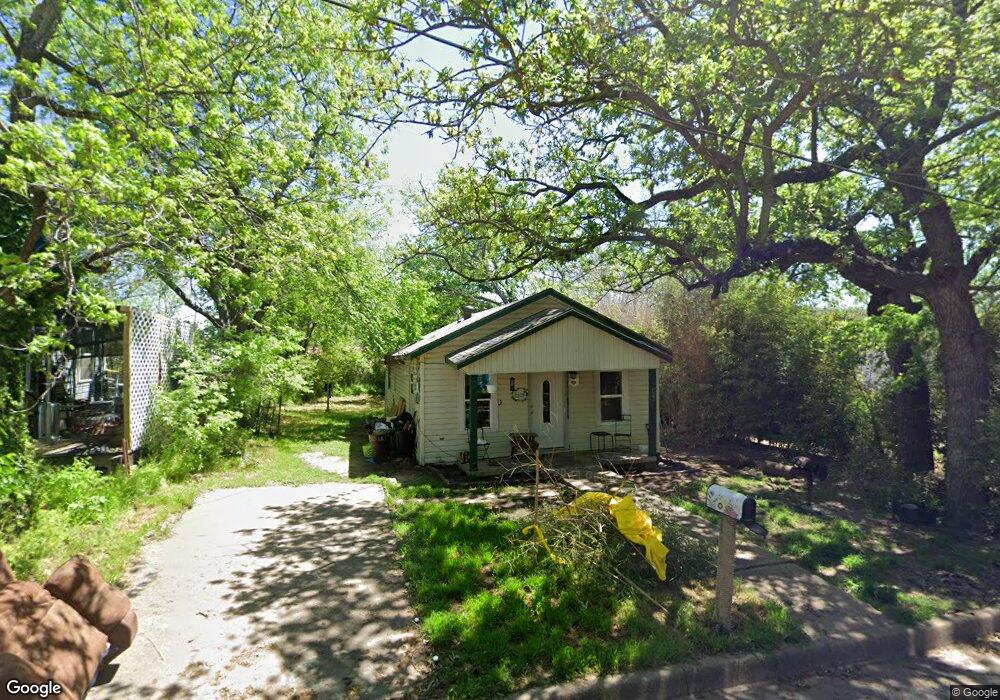
406 Shannon St Weatherford, TX 76086
Estimated Value: $137,682 - $288,000
--
Bed
--
Bath
665
Sq Ft
$284/Sq Ft
Est. Value
About This Home
This home is located at 406 Shannon St, Weatherford, TX 76086 and is currently estimated at $188,921, approximately $284 per square foot. 406 Shannon St is a home located in Parker County with nearby schools including Curtis Elementary School, Hall Middle School, and Weatherford High School.
Ownership History
Date
Name
Owned For
Owner Type
Purchase Details
Closed on
Jun 2, 2017
Sold by
Schleenvoigt Felix
Bought by
Redfearn Honora Ann Bradley
Current Estimated Value
Purchase Details
Closed on
Jul 18, 2006
Sold by
Dominguez Federico and Dominguez Maria E
Bought by
Redfearn Honora Ann Bradley
Purchase Details
Closed on
Jan 1, 1994
Bought by
Redfearn Honora Ann Bradley
Purchase Details
Closed on
May 30, 1985
Bought by
Redfearn Honora Ann Bradley
Create a Home Valuation Report for This Property
The Home Valuation Report is an in-depth analysis detailing your home's value as well as a comparison with similar homes in the area
Home Values in the Area
Average Home Value in this Area
Purchase History
| Date | Buyer | Sale Price | Title Company |
|---|---|---|---|
| Redfearn Honora Ann Bradley | -- | Sendera Title | |
| Redfearn Honora Ann Bradley | -- | -- | |
| Schleenvoigt Felix | -- | None Available | |
| Redfearn Honora Ann Bradley | -- | -- | |
| Redfearn Honora Ann Bradley | -- | -- |
Source: Public Records
Tax History Compared to Growth
Tax History
| Year | Tax Paid | Tax Assessment Tax Assessment Total Assessment is a certain percentage of the fair market value that is determined by local assessors to be the total taxable value of land and additions on the property. | Land | Improvement |
|---|---|---|---|---|
| 2025 | $2,311 | $142,060 | $50,000 | $92,060 |
| 2024 | $2,311 | $119,900 | $40,000 | $79,900 |
| 2023 | $2,311 | $119,900 | $40,000 | $79,900 |
| 2022 | $1,143 | $51,520 | $15,000 | $36,520 |
| 2021 | $1,237 | $51,520 | $15,000 | $36,520 |
| 2020 | $1,181 | $48,890 | $15,000 | $33,890 |
| 2019 | $1,248 | $48,890 | $15,000 | $33,890 |
| 2018 | $1,159 | $45,190 | $15,000 | $30,190 |
| 2017 | $1,189 | $45,190 | $15,000 | $30,190 |
| 2016 | $1,073 | $40,770 | $15,000 | $25,770 |
| 2015 | $1,051 | $40,770 | $15,000 | $25,770 |
| 2014 | $976 | $38,860 | $15,000 | $23,860 |
Source: Public Records
Map
Nearby Homes