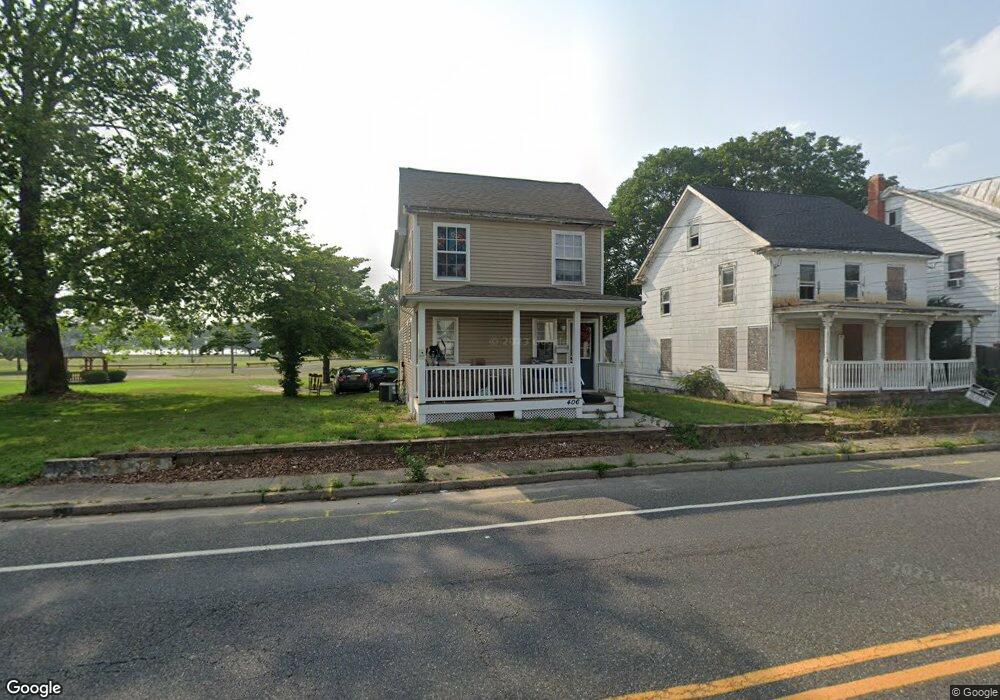
406 Sharp St N Millville, NJ 08332
Estimated Value: $153,000 - $186,000
3
Beds
1
Bath
1,412
Sq Ft
$118/Sq Ft
Est. Value
About This Home
This home is located at 406 Sharp St N, Millville, NJ 08332 and is currently estimated at $166,435, approximately $117 per square foot. 406 Sharp St N is a home located in Cumberland County with nearby schools including R.D. Wood Elementary School, Lakeside Middle School, and Memorial High School.
Ownership History
Date
Name
Owned For
Owner Type
Purchase Details
Closed on
Jul 8, 2011
Sold by
Ozdemir Hakan
Bought by
Garton Travis
Current Estimated Value
Home Financials for this Owner
Home Financials are based on the most recent Mortgage that was taken out on this home.
Original Mortgage
$63,250
Outstanding Balance
$4,737
Interest Rate
4.49%
Mortgage Type
Purchase Money Mortgage
Estimated Equity
$161,698
Purchase Details
Closed on
Apr 24, 2007
Sold by
Barnes Jeffrey P
Bought by
Ozdemir Hakan
Purchase Details
Closed on
Apr 28, 2003
Sold by
Salomon Brothers Realty Corp
Bought by
Barnes Jeffrey P
Create a Home Valuation Report for This Property
The Home Valuation Report is an in-depth analysis detailing your home's value as well as a comparison with similar homes in the area
Home Values in the Area
Average Home Value in this Area
Purchase History
| Date | Buyer | Sale Price | Title Company |
|---|---|---|---|
| Garton Travis | $85,000 | -- | |
| Ozdemir Hakan | $165,000 | -- | |
| Barnes Jeffrey P | $22,500 | -- |
Source: Public Records
Mortgage History
| Date | Status | Borrower | Loan Amount |
|---|---|---|---|
| Open | Garton Travis | $63,250 |
Source: Public Records
Tax History
| Year | Tax Paid | Tax Assessment Tax Assessment Total Assessment is a certain percentage of the fair market value that is determined by local assessors to be the total taxable value of land and additions on the property. | Land | Improvement |
|---|---|---|---|---|
| 2025 | $2,944 | $75,000 | $14,000 | $61,000 |
| 2024 | $2,919 | $75,000 | $14,000 | $61,000 |
| 2023 | $2,919 | $75,000 | $14,000 | $61,000 |
| 2022 | $2,843 | $75,000 | $14,000 | $61,000 |
| 2021 | $2,751 | $75,000 | $14,000 | $61,000 |
| 2020 | $2,705 | $75,000 | $14,000 | $61,000 |
| 2019 | $2,580 | $75,000 | $14,000 | $61,000 |
| 2018 | $2,527 | $75,000 | $14,000 | $61,000 |
| 2017 | $2,450 | $73,400 | $14,000 | $59,400 |
| 2016 | $2,419 | $73,400 | $14,000 | $59,400 |
| 2015 | $2,365 | $73,400 | $14,000 | $59,400 |
| 2014 | $2,369 | $73,400 | $14,000 | $59,400 |
Source: Public Records
Map
Nearby Homes
- 402 W Green St
- 400 W Green St
- 302 W Powell St
- 620 Dock St
- 10 Homestead Dr
- 709 & 707 Buck St
- 19 E Mcneal St
- 525 Dock St Unit B
- 525 Dock St Unit A
- 525 Dock St
- 515 Columbia Ave
- 10 E Broad St
- 504 Columbia Ave
- 500 Columbia Ave
- 625 Dove Dr
- 111 Mulford Ave
- 600 Glenside Rd
- 409 Buck St
- 1216 Forest Dr
- 503 N 2nd St
Your Personal Tour Guide
Ask me questions while you tour the home.