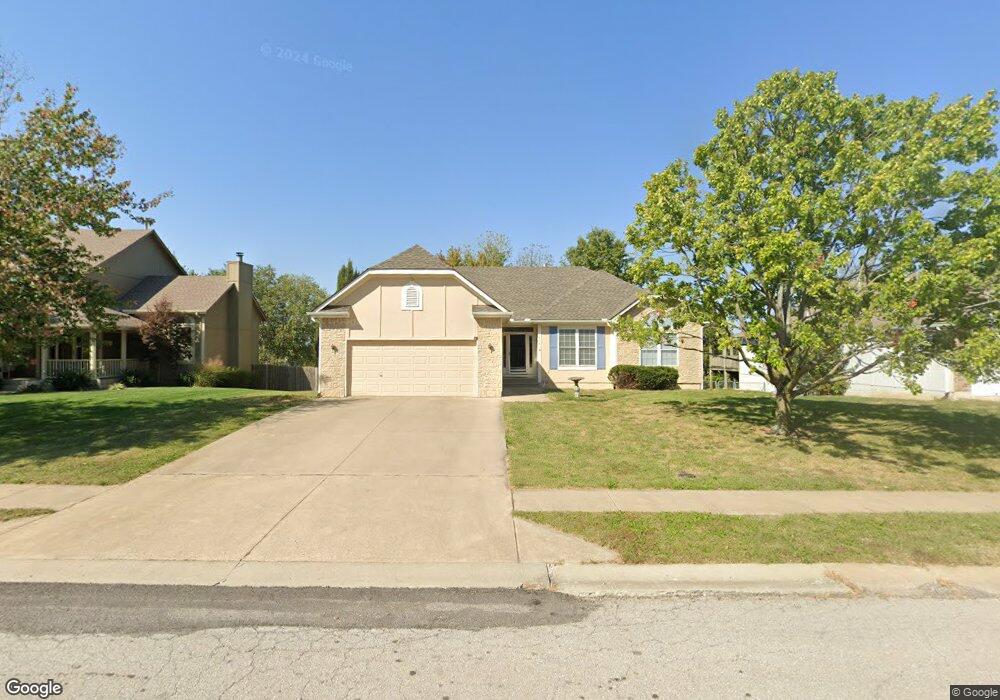
406 Shoreview Dr Raymore, MO 64083
Estimated Value: $334,676 - $360,000
3
Beds
2
Baths
1,506
Sq Ft
$228/Sq Ft
Est. Value
About This Home
This home is located at 406 Shoreview Dr, Raymore, MO 64083 and is currently estimated at $343,169, approximately $227 per square foot. 406 Shoreview Dr is a home located in Cass County with nearby schools including Eagle Glen Intermediate School, Raymore-Peculiar East Middle School, and Raymore-Peculiar Senior High School.
Create a Home Valuation Report for This Property
The Home Valuation Report is an in-depth analysis detailing your home's value as well as a comparison with similar homes in the area
Home Values in the Area
Average Home Value in this Area
Tax History
| Year | Tax Paid | Tax Assessment Tax Assessment Total Assessment is a certain percentage of the fair market value that is determined by local assessors to be the total taxable value of land and additions on the property. | Land | Improvement |
|---|---|---|---|---|
| 2025 | $2,869 | $39,920 | $5,390 | $34,530 |
| 2024 | $2,869 | $35,300 | $4,890 | $30,410 |
| 2023 | $2,869 | $35,300 | $4,890 | $30,410 |
| 2022 | $2,593 | $31,690 | $4,890 | $26,800 |
| 2021 | $2,593 | $31,690 | $4,890 | $26,800 |
| 2020 | $2,545 | $30,550 | $4,890 | $25,660 |
| 2019 | $2,457 | $30,550 | $4,890 | $25,660 |
| 2018 | $2,272 | $27,280 | $4,130 | $23,150 |
| 2017 | $2,078 | $27,280 | $4,130 | $23,150 |
| 2016 | $2,078 | $25,900 | $4,130 | $21,770 |
| 2015 | $2,079 | $25,900 | $4,130 | $21,770 |
| 2014 | $2,080 | $25,900 | $4,130 | $21,770 |
| 2013 | -- | $25,900 | $4,130 | $21,770 |
Source: Public Records
Map
Nearby Homes
- 600 W Buena Vista Dr
- 108 Rainbow Cir
- 901 W Lucy Webb Rd
- 201 Johnston Dr
- 713 S Sunset Ln
- 1108 Yokley Dr
- 105 N Landcaster Dr
- 727 Country Ln
- 205 N Pacific Ct
- 1105 Creekside Ct
- 208 N Pacific Ct
- 814 Coventry Ln
- 416 S Jefferson St
- 817 Clancy Ct
- 709 Derby St
- 506 S Adams St
- 205 Johnston Pkwy
- 1206 W Lucy Webb Rd
- 405 Sunny Ln
- 113 N Eastglen Dr
- 404 Shoreview Dr
- 408 Shoreview Dr
- 405 Bayview Dr
- 407 Bayview Dr
- 402 Shoreview Dr
- 410 Shoreview Dr
- 409 Bayview Dr
- 403 Bayview Dr
- 704 Shorevista Ct
- 407 Shoreview Dr
- 412 Shoreview Dr
- 405 Shoreview Dr
- 400 Shoreview Dr
- 707 W Buena Vista Dr
- 403 Shoreview Dr
- 702 Shorevista Ct
- 404 Bayview Dr
- 406 Bayview Dr
- 705 Shorevista Ct
- 500 Shoreview Dr
Your Personal Tour Guide
Ask me questions while you tour the home.