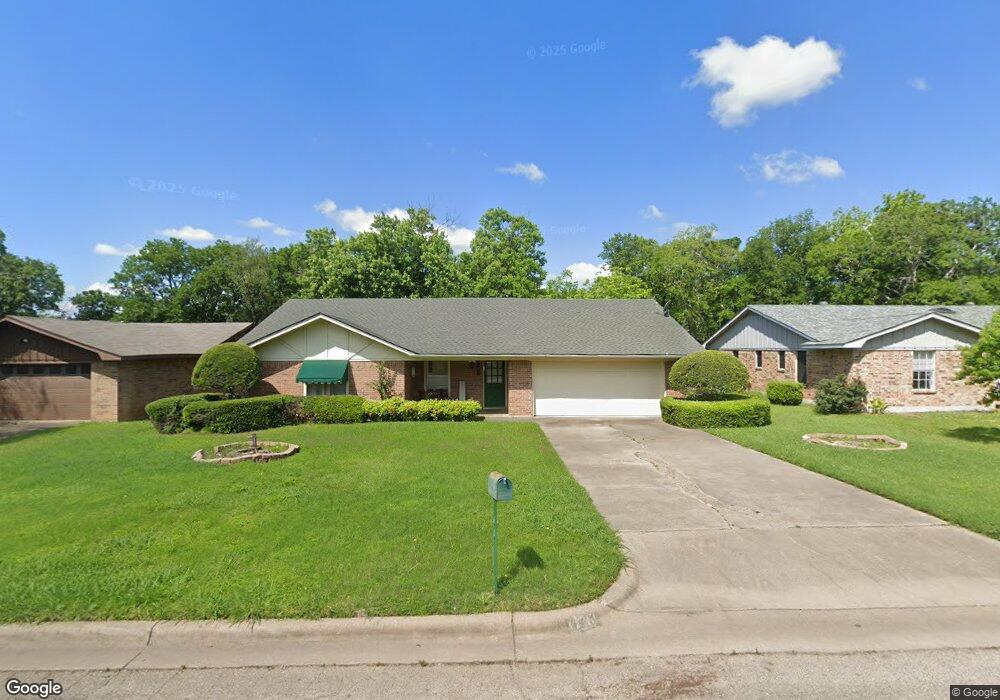
406 Sunset Dr Cleburne, TX 76033
Osage-North Fisk NeighborhoodEstimated Value: $237,730 - $259,000
2
Beds
2
Baths
1,584
Sq Ft
$157/Sq Ft
Est. Value
About This Home
This home is located at 406 Sunset Dr, Cleburne, TX 76033 and is currently estimated at $249,433, approximately $157 per square foot. 406 Sunset Dr is a home located in Johnson County with nearby schools including Coleman Elementary School, Lowell Smith Jr. Middle School, and Cleburne High School.
Ownership History
Date
Name
Owned For
Owner Type
Purchase Details
Closed on
Apr 1, 2018
Sold by
Putty John and Chaney Sylvia
Bought by
Putty John L and Putty Sylivia N
Current Estimated Value
Home Financials for this Owner
Home Financials are based on the most recent Mortgage that was taken out on this home.
Original Mortgage
$250,500
Outstanding Balance
$215,526
Interest Rate
4.46%
Mortgage Type
FHA
Estimated Equity
$33,907
Purchase Details
Closed on
Jun 26, 2015
Sold by
Stringer Roby C and Stringer Melissa S
Bought by
Putty John and Chaney Sylvia
Home Financials for this Owner
Home Financials are based on the most recent Mortgage that was taken out on this home.
Original Mortgage
$112,917
Interest Rate
4.25%
Mortgage Type
FHA
Purchase Details
Closed on
Dec 29, 2011
Sold by
Stringer Roby and Stringer Roby C
Bought by
Stringer Roby C and Stringer Melissa S
Home Financials for this Owner
Home Financials are based on the most recent Mortgage that was taken out on this home.
Original Mortgage
$40,800
Interest Rate
4.02%
Mortgage Type
New Conventional
Purchase Details
Closed on
Apr 1, 2009
Sold by
Pool Gaila Mae
Bought by
Ven Ken Inc
Create a Home Valuation Report for This Property
The Home Valuation Report is an in-depth analysis detailing your home's value as well as a comparison with similar homes in the area
Home Values in the Area
Average Home Value in this Area
Purchase History
| Date | Buyer | Sale Price | Title Company |
|---|---|---|---|
| Putty John L | -- | Alamo Title Co | |
| Putty John | -- | Stnt | |
| Stringer Roby C | -- | Federal Title Inc | |
| Ven Ken Inc | -- | None Available |
Source: Public Records
Mortgage History
| Date | Status | Borrower | Loan Amount |
|---|---|---|---|
| Open | Putty John L | $250,500 | |
| Closed | Putty John | $112,917 | |
| Previous Owner | Stringer Roby C | $40,800 |
Source: Public Records
Tax History Compared to Growth
Tax History
| Year | Tax Paid | Tax Assessment Tax Assessment Total Assessment is a certain percentage of the fair market value that is determined by local assessors to be the total taxable value of land and additions on the property. | Land | Improvement |
|---|---|---|---|---|
| 2025 | $1,096 | $185,428 | $62,000 | $123,428 |
| 2024 | $4,134 | $185,428 | $62,000 | $123,428 |
| 2023 | $1,096 | $185,428 | $62,000 | $123,428 |
| 2022 | $3,985 | $185,428 | $62,000 | $123,428 |
| 2021 | $3,777 | $185,428 | $62,000 | $123,428 |
| 2020 | $3,646 | $131,586 | $30,000 | $101,586 |
| 2019 | $3,792 | $131,586 | $30,000 | $101,586 |
| 2018 | $3,448 | $116,652 | $20,250 | $96,402 |
| 2017 | $3,434 | $116,652 | $20,250 | $96,402 |
| 2016 | $3,197 | $108,619 | $20,250 | $88,369 |
| 2015 | $2,659 | $108,619 | $20,250 | $88,369 |
| 2014 | $2,659 | $99,743 | $20,250 | $79,493 |
Source: Public Records
Map
Nearby Homes
- 311 Sunset Dr
- 215 Sunset Dr
- 714 Forrest Ave
- 616 Bellevue Dr
- 611 Forrest Ave
- 404 Forrest Ave
- 505 W Earl St
- 1107 Stanwood Ave
- 4112 Highland Dr
- 4101 Highland Dr
- 909 Highland Dr
- 1103 Trace Rd
- 603 S Walnut St
- 101 S Pendell Ave
- 415 Featherston St
- 911 W Chambers St
- 306 Prairie Ave
- 1115 Green River Trail
- 1503 Stanwood Ave
- 1116 Willowcreek Rd