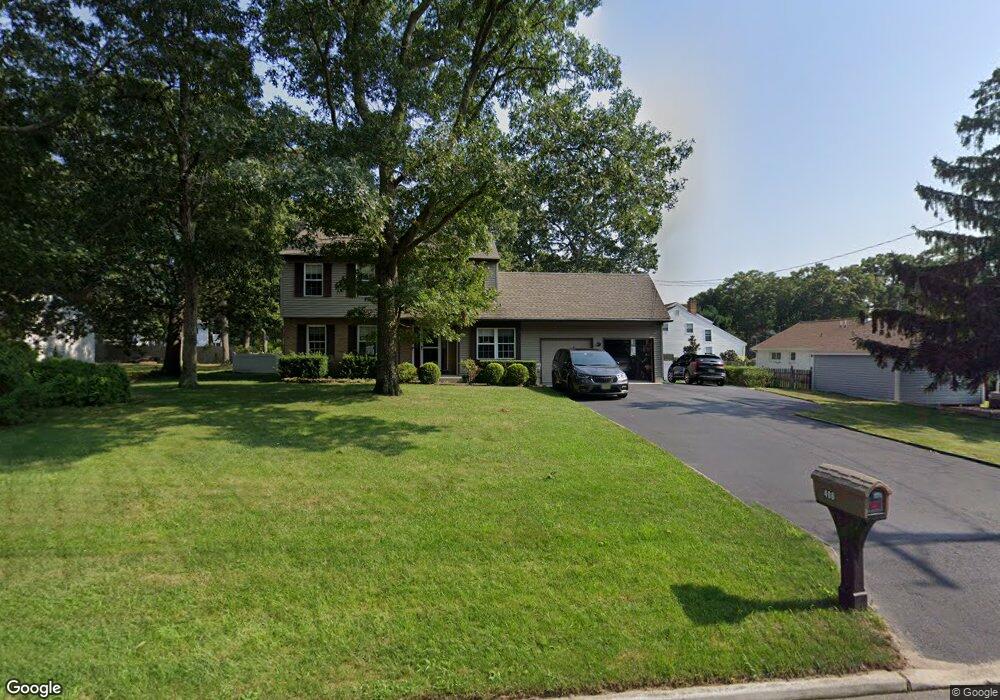
406 Tuckahoe Rd Marmora, NJ 08223
Estimated Value: $507,317 - $613,000
3
Beds
3
Baths
2,340
Sq Ft
$234/Sq Ft
Est. Value
About This Home
This home is located at 406 Tuckahoe Rd, Marmora, NJ 08223 and is currently estimated at $546,829, approximately $233 per square foot. 406 Tuckahoe Rd is a home located in Cape May County with nearby schools including Upper Township Primary School, Upper Township Elementary School, and Upper Township Middle School.
Ownership History
Date
Name
Owned For
Owner Type
Purchase Details
Closed on
Nov 27, 1991
Sold by
Tomlin Belva J and Tomlin Marchetti,Roya
Bought by
Johns Bruce R and Johns Joanna
Current Estimated Value
Purchase Details
Closed on
Feb 27, 1989
Sold by
Garman George and Garman Karen
Bought by
Tomlin Belva J and Tomlin Roy
Create a Home Valuation Report for This Property
The Home Valuation Report is an in-depth analysis detailing your home's value as well as a comparison with similar homes in the area
Home Values in the Area
Average Home Value in this Area
Purchase History
| Date | Buyer | Sale Price | Title Company |
|---|---|---|---|
| Johns Bruce R | $136,000 | -- | |
| Johns Bruce R | $136,000 | -- | |
| Tomlin Belva J | $126,000 | -- |
Source: Public Records
Tax History Compared to Growth
Tax History
| Year | Tax Paid | Tax Assessment Tax Assessment Total Assessment is a certain percentage of the fair market value that is determined by local assessors to be the total taxable value of land and additions on the property. | Land | Improvement |
|---|---|---|---|---|
| 2025 | $5,788 | $252,200 | $91,900 | $160,300 |
| 2024 | $5,788 | $252,200 | $91,900 | $160,300 |
| 2023 | $5,503 | $252,200 | $91,900 | $160,300 |
| 2022 | $5,110 | $252,200 | $91,900 | $160,300 |
| 2021 | $3,784 | $252,200 | $91,900 | $160,300 |
| 2020 | $4,915 | $252,200 | $91,900 | $160,300 |
| 2019 | $4,784 | $252,200 | $91,900 | $160,300 |
| 2018 | $4,658 | $252,200 | $91,900 | $160,300 |
| 2017 | $4,600 | $252,200 | $91,900 | $160,300 |
| 2016 | $4,092 | $220,600 | $91,900 | $128,700 |
| 2015 | $3,982 | $220,600 | $91,900 | $128,700 |
| 2014 | $4,444 | $301,900 | $135,700 | $166,200 |
Source: Public Records
Map
Nearby Homes
- 200 Egret
- 315 N Quail Dr
- Hadley Plan at Coastal Cove
- Hampshire Plan at Coastal Cove
- 430 Route Us 9 S Unit 109
- 430 U S 9
- 516 N Route 9 Unit L-2
- 46 Church Rd
- 430 S Shore Rd
- 166 Heron Ln
- 14 Roberts Ave
- 238 Egret Ln
- 246 Egret Ln
- 1 Roosevelt Blvd
- 61 S Lake Dr
- 734 Stagecoach Rd
- 14 Bank Rd
- 14 Lyndhurst Rd
- 32 Norwood Rd
- 202 N Shore Rd