Estimated Value: $164,000 - $199,000
6
Beds
3
Baths
2,722
Sq Ft
$69/Sq Ft
Est. Value
About This Home
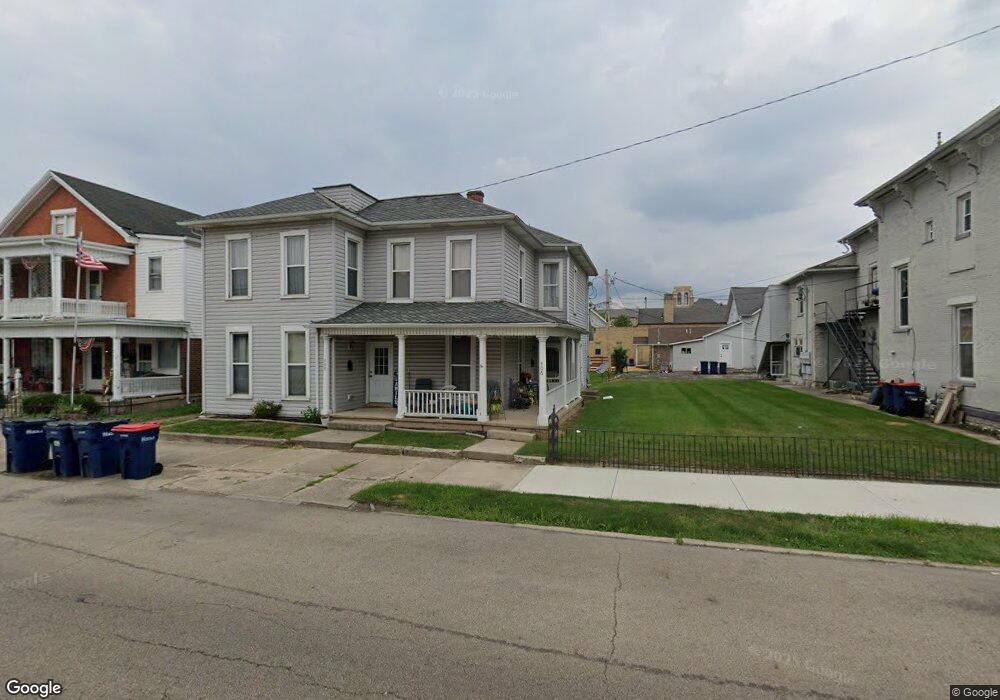
This home is located at 406 W High St, Piqua, OH 45356 and is currently estimated at $186,905, approximately $68 per square foot. 406 W High St is a home located in Miami County with nearby schools including Piqua Central Intermediate School, Springcreek Primary School, and Piqua Junior High School.
Ownership History
Date
Name
Owned For
Owner Type
Purchase Details
Closed on
May 14, 2009
Sold by
Piqua Improvement Corp
Bought by
Murray Property Investments Llc
Current Estimated Value
Purchase Details
Closed on
Jan 5, 2009
Sold by
Unity National Bank
Bought by
Piqua Improvement Corp
Purchase Details
Closed on
Oct 29, 2008
Sold by
Bennett Cindy
Bought by
Unity National Bank
Purchase Details
Closed on
Jul 29, 2003
Sold by
Kindell Gary L
Bought by
Bennett Cindy J and Bennett Danny J
Purchase Details
Closed on
Oct 31, 1994
Sold by
Philip S Sullenberger
Bought by
Kindell Gary L and Kindell Mary L
Create a Home Valuation Report for This Property
The Home Valuation Report is an in-depth analysis detailing your home's value as well as a comparison with similar homes in the area
Home Values in the Area
Average Home Value in this Area
Purchase History
| Date | Buyer | Sale Price | Title Company |
|---|---|---|---|
| Murray Property Investments Llc | $5,000 | -- | |
| Piqua Improvement Corp | -- | -- | |
| Unity National Bank | $38,000 | -- | |
| Bennett Cindy J | $78,000 | -- | |
| Kindell Gary L | $60,000 | -- |
Source: Public Records
Mortgage History
| Date | Status | Borrower | Loan Amount |
|---|---|---|---|
| Closed | Kindell Gary L | -- | |
| Closed | Bennett Cindy J | $0 |
Source: Public Records
Tax History Compared to Growth
Tax History
| Year | Tax Paid | Tax Assessment Tax Assessment Total Assessment is a certain percentage of the fair market value that is determined by local assessors to be the total taxable value of land and additions on the property. | Land | Improvement |
|---|---|---|---|---|
| 2024 | $1,740 | $41,270 | $9,240 | $32,030 |
| 2023 | $1,740 | $41,270 | $9,240 | $32,030 |
| 2022 | $1,770 | $41,270 | $9,240 | $32,030 |
| 2021 | $1,485 | $31,750 | $7,110 | $24,640 |
| 2020 | $1,459 | $31,750 | $7,110 | $24,640 |
| 2019 | $1,467 | $31,750 | $7,110 | $24,640 |
| 2018 | $1,380 | $28,460 | $7,140 | $21,320 |
| 2017 | $1,397 | $28,460 | $7,140 | $21,320 |
| 2016 | $1,383 | $28,460 | $7,140 | $21,320 |
| 2015 | $343 | $6,900 | $6,860 | $40 |
| 2014 | $343 | $6,900 | $6,860 | $40 |
| 2013 | $344 | $6,900 | $6,860 | $40 |
Source: Public Records
Map
Nearby Homes