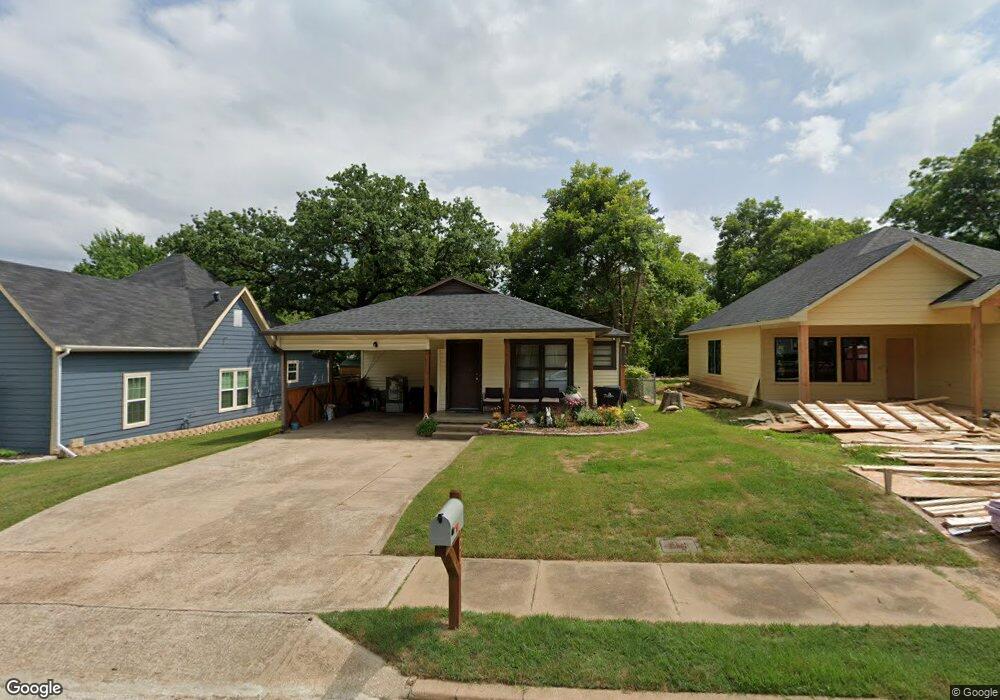
406 W Monterey St Denison, TX 75020
Estimated Value: $145,000 - $209,777
2
Beds
1
Bath
1,119
Sq Ft
$159/Sq Ft
Est. Value
About This Home
This home is located at 406 W Monterey St, Denison, TX 75020 and is currently estimated at $177,389, approximately $158 per square foot. 406 W Monterey St is a home located in Grayson County with nearby schools including Scott Middle School, Denison High School, and St. Luke's Parish Day School.
Ownership History
Date
Name
Owned For
Owner Type
Purchase Details
Closed on
Jun 13, 2020
Sold by
Texoma S & D Properties Inc
Bought by
Lopez Aifredo Cisneros and Hernandez Alma Rosa
Current Estimated Value
Home Financials for this Owner
Home Financials are based on the most recent Mortgage that was taken out on this home.
Original Mortgage
$72,000
Outstanding Balance
$63,822
Interest Rate
3.2%
Mortgage Type
Purchase Money Mortgage
Estimated Equity
$113,567
Purchase Details
Closed on
Oct 15, 2019
Sold by
Zamir Kathy
Bought by
406 Monterey Series Llc
Purchase Details
Closed on
Mar 21, 2015
Sold by
Blake Patrick L
Bought by
Monterey Street 406 Land Trust
Purchase Details
Closed on
Feb 9, 2007
Sold by
Harris James C and Harris Carolyn F
Bought by
Blake Patrick L and Weatheread Catherine E
Home Financials for this Owner
Home Financials are based on the most recent Mortgage that was taken out on this home.
Original Mortgage
$48,665
Interest Rate
6.13%
Mortgage Type
Purchase Money Mortgage
Create a Home Valuation Report for This Property
The Home Valuation Report is an in-depth analysis detailing your home's value as well as a comparison with similar homes in the area
Home Values in the Area
Average Home Value in this Area
Purchase History
| Date | Buyer | Sale Price | Title Company |
|---|---|---|---|
| Lopez Aifredo Cisneros | -- | None Available | |
| 406 Monterey Series Llc | -- | None Available | |
| Monterey Street 406 Land Trust | -- | None Available | |
| Blake Patrick L | -- | Chapin Title Co Inc |
Source: Public Records
Mortgage History
| Date | Status | Borrower | Loan Amount |
|---|---|---|---|
| Open | Lopez Aifredo Cisneros | $72,000 | |
| Previous Owner | Blake Patrick L | $48,665 |
Source: Public Records
Tax History Compared to Growth
Tax History
| Year | Tax Paid | Tax Assessment Tax Assessment Total Assessment is a certain percentage of the fair market value that is determined by local assessors to be the total taxable value of land and additions on the property. | Land | Improvement |
|---|---|---|---|---|
| 2025 | $2,784 | $118,263 | $34,875 | $83,388 |
| 2024 | $2,784 | $119,825 | $34,875 | $84,950 |
| 2023 | $2,632 | $116,180 | $34,950 | $81,230 |
| 2022 | $2,338 | $98,394 | $31,050 | $67,344 |
| 2021 | $1,870 | $74,144 | $20,625 | $53,519 |
| 2020 | $1,821 | $69,027 | $15,000 | $54,027 |
| 2019 | $1,417 | $51,496 | $9,000 | $42,496 |
| 2018 | $1,765 | $63,608 | $6,000 | $57,608 |
| 2017 | $1,605 | $57,370 | $2,400 | $54,970 |
| 2016 | $1,417 | $50,637 | $2,400 | $48,237 |
| 2015 | $0 | $40,265 | $2,400 | $37,865 |
| 2014 | -- | $40,061 | $2,400 | $37,661 |
Source: Public Records
Map
Nearby Homes
- 408 W Heron St
- 415 W Monterey St
- 309 W Monterey St
- 330 W Texas St
- 328 W Murray St
- 513 W Murray St
- 231 W Murray St
- 221 W Monterey St
- 513 W Texas St
- 509 W Acheson St
- TBD S Austin Ave
- 615 W Texas St
- 430 W Munson St
- 525 W Hanna St
- 111 W Murray St
- 708 W Texas St
- 511 W Munson St
- 704 W Hull St
- 701 W Hull St Unit 101-2
- 101 E Murray St
- 412 W Monterey St
- 400 W Monterey St
- 416 W Monterey St
- 418 W Monterey St
- 405 W Heron St
- 401 W Heron St
- 413 W Heron St
- 420 W Monterey St
- 405 W Monterey St
- 407 W Monterey St
- 401 W Monterey St
- 419 W Monterey St
- 424 W Monterey St
- 423 W Monterey St
- 421 W Heron St
- 329 W Monterey St
- 430 W Monterey St
- 327 W Monterey St
- 427 W Monterey St
- 431 W Heron St