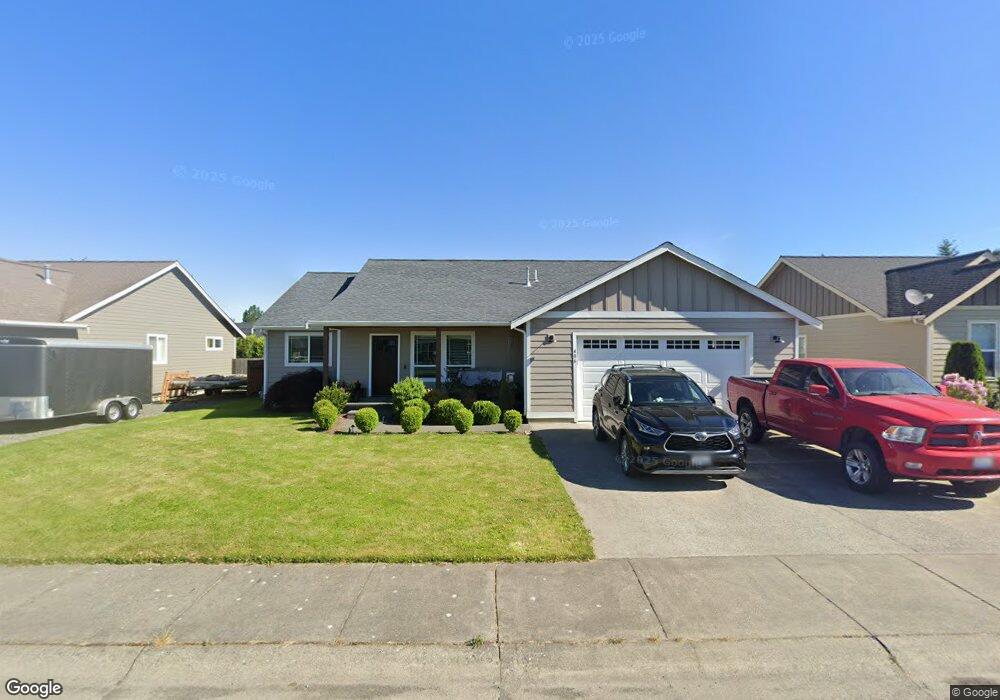
406 Westview Place Everson, WA 98247
Estimated Value: $473,000 - $546,000
3
Beds
2
Baths
1,641
Sq Ft
$315/Sq Ft
Est. Value
About This Home
This home is located at 406 Westview Place, Everson, WA 98247 and is currently estimated at $516,641, approximately $314 per square foot. 406 Westview Place is a home located in Whatcom County with nearby schools including Nooksack Elementary School, Everson Elementary School, and Sumas Elementary School.
Ownership History
Date
Name
Owned For
Owner Type
Purchase Details
Closed on
Sep 30, 2024
Sold by
Williams Klayton D and Williams Cara R
Bought by
Wright Spencer and Wright Jessica
Current Estimated Value
Home Financials for this Owner
Home Financials are based on the most recent Mortgage that was taken out on this home.
Original Mortgage
$509,500
Outstanding Balance
$502,269
Interest Rate
6.46%
Mortgage Type
VA
Estimated Equity
$14,372
Purchase Details
Closed on
Oct 9, 2013
Sold by
Heutink Rocky L and Heutink Sue Ann
Bought by
Williams Klayton D and Williams Cara R
Home Financials for this Owner
Home Financials are based on the most recent Mortgage that was taken out on this home.
Original Mortgage
$224,000
Interest Rate
4.49%
Mortgage Type
VA
Purchase Details
Closed on
Jul 8, 2008
Sold by
Johnson Construction & Excavating Inc
Bought by
Heutink Rocky L and Heutink Sue Ann
Create a Home Valuation Report for This Property
The Home Valuation Report is an in-depth analysis detailing your home's value as well as a comparison with similar homes in the area
Purchase History
| Date | Buyer | Sale Price | Title Company |
|---|---|---|---|
| Wright Spencer | $509,500 | Chicago Title | |
| Williams Klayton D | $227,280 | Chicago Title Insurance | |
| Heutink Rocky L | $250,280 | Chicago Title Insurance |
Source: Public Records
Mortgage History
| Date | Status | Borrower | Loan Amount |
|---|---|---|---|
| Open | Wright Spencer | $509,500 | |
| Previous Owner | Williams Klayton D | $224,000 |
Source: Public Records
Tax History
| Year | Tax Paid | Tax Assessment Tax Assessment Total Assessment is a certain percentage of the fair market value that is determined by local assessors to be the total taxable value of land and additions on the property. | Land | Improvement |
|---|---|---|---|---|
| 2025 | $4,498 | $485,673 | $188,100 | $297,573 |
| 2024 | $4,648 | $470,315 | $180,000 | $290,315 |
| 2023 | $4,648 | $505,071 | $137,744 | $367,327 |
| 2022 | $4,146 | $455,027 | $124,096 | $330,931 |
| 2021 | $3,851 | $376,061 | $102,560 | $273,501 |
| 2020 | $3,695 | $305,747 | $83,384 | $222,363 |
| 2019 | $3,054 | $305,747 | $83,384 | $222,363 |
| 2018 | $3,379 | $293,339 | $80,000 | $213,339 |
| 2017 | $3,019 | $241,413 | $63,800 | $177,613 |
| 2016 | $2,814 | $222,777 | $58,850 | $163,927 |
| 2015 | $2,387 | $208,532 | $51,600 | $156,932 |
| 2014 | -- | $202,066 | $50,000 | $152,066 |
| 2013 | -- | $202,066 | $50,000 | $152,066 |
Source: Public Records
Map
Nearby Homes
- 404 W 3rd St
- 308 W 3rd St
- 412 W 3rd St
- 304 W 3rd St
- 109 W 2nd St
- 107 Thendara Park Dr Unit C
- 107 S Pass Rd Unit 23
- 512 Allison Way
- 207 E Main St
- 702 N Washington St
- 705 E 6th St
- 108 Baker St Unit 1-4
- 409 W 4th St
- 7554 Nooksack Rd
- 3292 S Pass Rd
- 303 Lincoln St
- 0 Walnut Grove Ct
- 408 W 3rd St
- 416 W 3rd St
- 3037 Massey Rd
- 406 Westview Place
- 408 Westview Place
- 405 Amareen Ct
- 402 Westview Place
- 410 Westview Place
- 407 Amareen Ct
- 403 Amareen Ct
- 401 Amareen Ct
- 409 Amareen Ct
- 405 Westview Place
- 415 W 3rd St
- 403 Westview Place
- 407 Westview Place
- 412 Westview Place
- 401 Westview Place
- 401 Westview Place
- 409 Westview Place
- 411 Amareen Ct
- 405 W 3rd St
Your Personal Tour Guide
Ask me questions while you tour the home.