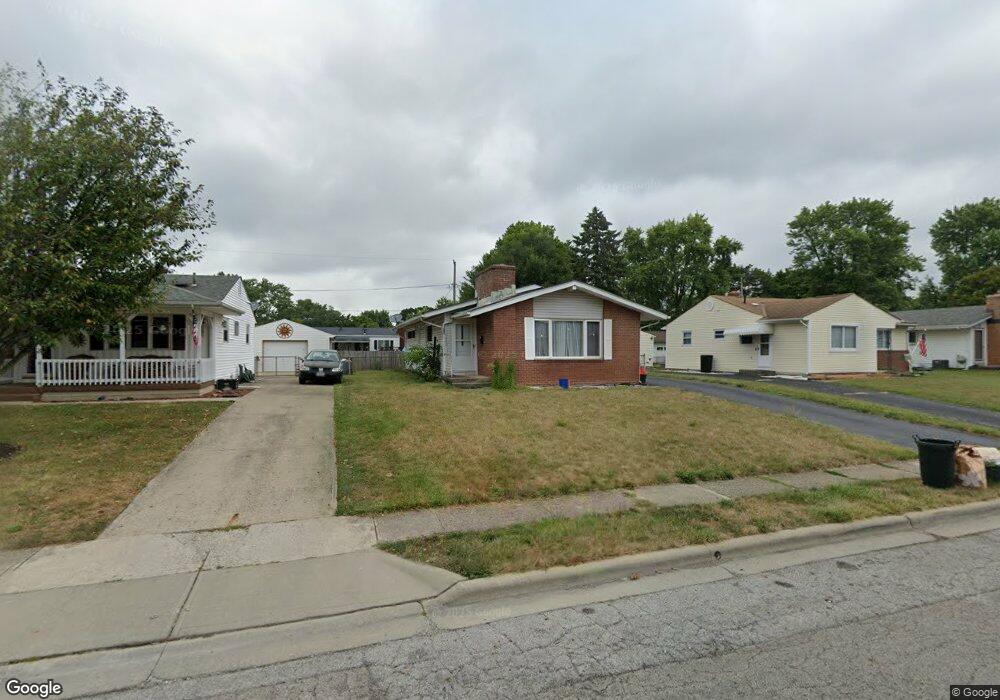
4060 Etna St Columbus, OH 43213
Estimated Value: $153,000 - $221,000
3
Beds
1
Bath
1,147
Sq Ft
$168/Sq Ft
Est. Value
About This Home
This home is located at 4060 Etna St, Columbus, OH 43213 and is currently estimated at $193,212, approximately $168 per square foot. 4060 Etna St is a home located in Franklin County with nearby schools including Beechwood Elementary School, Etna Road Elementary School, and Rosemore Middle School.
Ownership History
Date
Name
Owned For
Owner Type
Purchase Details
Closed on
Jun 29, 2018
Sold by
Beck Steven and Beck Robert E
Bought by
Beck Cathlene E
Current Estimated Value
Home Financials for this Owner
Home Financials are based on the most recent Mortgage that was taken out on this home.
Original Mortgage
$72,000
Outstanding Balance
$62,399
Interest Rate
4.5%
Mortgage Type
Future Advance Clause Open End Mortgage
Estimated Equity
$130,813
Purchase Details
Closed on
Jun 5, 2018
Bought by
Beck Robert E
Home Financials for this Owner
Home Financials are based on the most recent Mortgage that was taken out on this home.
Original Mortgage
$72,000
Outstanding Balance
$62,399
Interest Rate
4.5%
Mortgage Type
Future Advance Clause Open End Mortgage
Estimated Equity
$130,813
Purchase Details
Closed on
May 5, 1978
Bought by
Beck Robert E
Create a Home Valuation Report for This Property
The Home Valuation Report is an in-depth analysis detailing your home's value as well as a comparison with similar homes in the area
Home Values in the Area
Average Home Value in this Area
Purchase History
| Date | Buyer | Sale Price | Title Company |
|---|---|---|---|
| Beck Cathlene E | $90,000 | Monarch Title Secs Llc | |
| Beck Robert E | -- | -- | |
| Beck Robert E | -- | -- |
Source: Public Records
Mortgage History
| Date | Status | Borrower | Loan Amount |
|---|---|---|---|
| Open | Beck Cathlene E | $72,000 |
Source: Public Records
Tax History Compared to Growth
Tax History
| Year | Tax Paid | Tax Assessment Tax Assessment Total Assessment is a certain percentage of the fair market value that is determined by local assessors to be the total taxable value of land and additions on the property. | Land | Improvement |
|---|---|---|---|---|
| 2024 | $2,542 | $58,140 | $17,920 | $40,220 |
| 2023 | $2,523 | $58,135 | $17,920 | $40,215 |
| 2022 | $1,991 | $34,860 | $5,740 | $29,120 |
| 2021 | $1,870 | $34,860 | $5,740 | $29,120 |
| 2020 | $1,851 | $34,860 | $5,740 | $29,120 |
| 2019 | $1,683 | $27,550 | $4,590 | $22,960 |
| 2018 | $1,262 | $27,550 | $4,590 | $22,960 |
| 2017 | $1,226 | $27,550 | $4,590 | $22,960 |
| 2016 | $1,342 | $29,300 | $5,390 | $23,910 |
| 2015 | $1,354 | $29,300 | $5,390 | $23,910 |
| 2014 | $1,354 | $29,300 | $5,390 | $23,910 |
| 2013 | $746 | $32,550 | $5,985 | $26,565 |
Source: Public Records
Map
Nearby Homes
- 4148 Elbern Ave
- 3814 Elbern Ave
- 320 Collingwood Ave
- 526 Collingwood Ave
- 4368 Broadhurst Dr
- 3811 Brentwood Ct
- 579 Westphal Ave
- 798 S Yearling Rd
- 91 Robinwood Ave
- 4094 E Main St
- 4489 Saint Margaret Ln
- 451 Beaver Ave
- 4144 Mcallister Ave
- 91 Maplewood Ave
- 963 Erickson Ave
- 571 S Hamilton Rd
- 4572 Saint Anthony Ln
- 178 S Weyant Ave
- 201 S Weyant Ave
- 931 E Fulton St