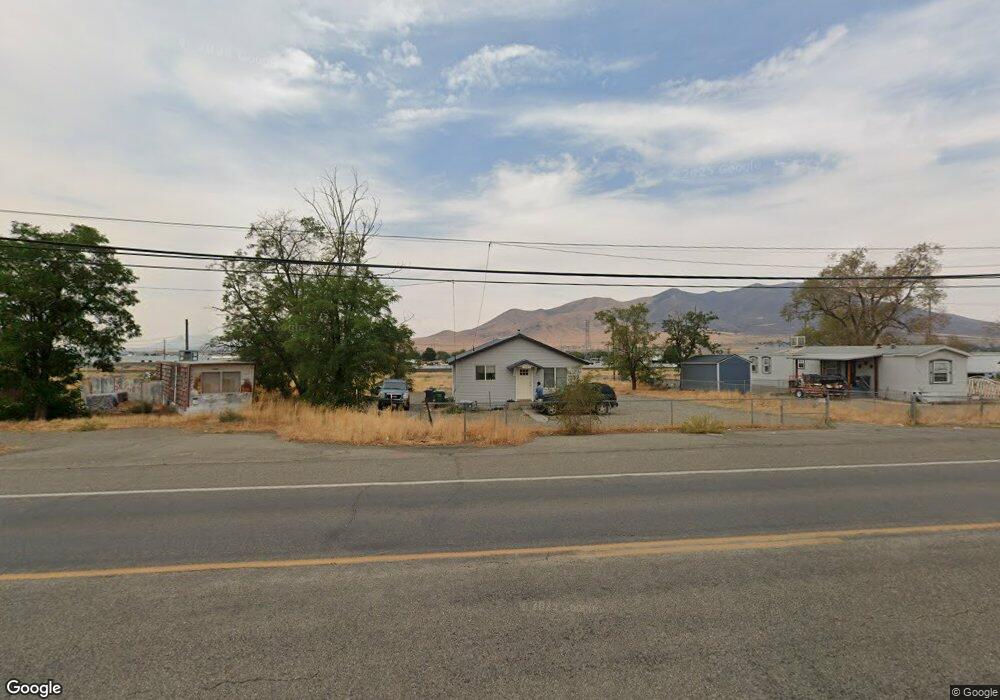
4060 Grass Valley Rd Winnemucca, NV 89445
Estimated Value: $201,000 - $209,753
3
Beds
1
Bath
972
Sq Ft
$212/Sq Ft
Est. Value
About This Home
This home is located at 4060 Grass Valley Rd, Winnemucca, NV 89445 and is currently estimated at $205,688, approximately $211 per square foot. 4060 Grass Valley Rd is a home located in Humboldt County with nearby schools including Sonoma Heights Elementary School, Winnemucca Junior High School, and French Ford Middle School.
Ownership History
Date
Name
Owned For
Owner Type
Purchase Details
Closed on
Aug 24, 2024
Sold by
Wen-Mair Llc
Bought by
Guerrero Omar Magana
Current Estimated Value
Home Financials for this Owner
Home Financials are based on the most recent Mortgage that was taken out on this home.
Original Mortgage
$135,000
Outstanding Balance
$133,318
Interest Rate
6.77%
Mortgage Type
New Conventional
Estimated Equity
$72,370
Purchase Details
Closed on
Feb 29, 2024
Sold by
Allied Trustee Services and Automatic Fund Transfer Svc I
Bought by
Wen-Mair Llc
Purchase Details
Closed on
Oct 12, 2017
Sold by
Keener Ray B and Keener Elizabeth Ann
Bought by
Daniels Justin J and Daniels Chelsea
Home Financials for this Owner
Home Financials are based on the most recent Mortgage that was taken out on this home.
Original Mortgage
$150,000
Interest Rate
3.78%
Mortgage Type
Seller Take Back
Create a Home Valuation Report for This Property
The Home Valuation Report is an in-depth analysis detailing your home's value as well as a comparison with similar homes in the area
Home Values in the Area
Average Home Value in this Area
Purchase History
| Date | Buyer | Sale Price | Title Company |
|---|---|---|---|
| Guerrero Omar Magana | $165,000 | Core Title Group Llc | |
| Wen-Mair Llc | $127,223 | Stewart Title Company | |
| Daniels Justin J | $150,000 | Western Title Company |
Source: Public Records
Mortgage History
| Date | Status | Borrower | Loan Amount |
|---|---|---|---|
| Open | Guerrero Omar Magana | $135,000 | |
| Previous Owner | Daniels Justin J | $150,000 |
Source: Public Records
Tax History Compared to Growth
Tax History
| Year | Tax Paid | Tax Assessment Tax Assessment Total Assessment is a certain percentage of the fair market value that is determined by local assessors to be the total taxable value of land and additions on the property. | Land | Improvement |
|---|---|---|---|---|
| 2025 | $593 | $20,419 | $9,975 | $10,444 |
| 2024 | $566 | $20,267 | $9,975 | $10,291 |
| 2023 | $566 | $19,413 | $9,975 | $9,438 |
| 2022 | $501 | $17,783 | $9,975 | $7,808 |
| 2021 | $490 | $17,566 | $9,975 | $7,591 |
| 2020 | $472 | $17,376 | $9,975 | $7,401 |
| 2019 | $462 | $16,995 | $9,975 | $7,020 |
| 2018 | $451 | $16,691 | $9,975 | $6,716 |
| 2017 | $441 | $14,459 | $7,875 | $6,584 |
| 2016 | $442 | $14,419 | $7,875 | $6,544 |
| 2015 | $448 | $14,234 | $7,875 | $6,359 |
| 2014 | $448 | $14,003 | $7,875 | $6,128 |
Source: Public Records
Map
Nearby Homes
- 3299 Traders Way
- 4180 Turner Ln
- 3268 Traders Way
- 15948 S Grass Valley Rd
- 13912 Grass Valley Rd
- 609 Sheehan St
- 3617 Crown Royal Cir
- 3 Colado Ct
- 502 Prebble St
- 0 U S Route 95
- 84 U S Route 95
- 6040408 U S Route 95
- 85 U S Route 95
- 406 W 5th St
- 16-0541-03 Walther Ln
- 540 Aiken St
- 702 W Mcarthur Ave Unit 56
- 702 W Mcarthur Ave Unit 82
- 134 W Shepard St
- 121 W Shepard St
- 4012 Grass Valley Rd
- 4010 Grass Valley Rd
- 3020 Sunny Dr
- 4050 Center St
- 3080 Windy Way
- 0 Grass Valley Rd Unit 140004744
- 0 Grass Valley Rd Unit 140011841
- 0 Grass Valley Rd Unit 140000106
- 0 Grass Valley Rd Unit 190013076
- 0 Grass Valley Rd Unit 130004033
- 10034106 APN Grass Valley Rd
- 0 Grass Valley Rd Unit 210008695
- 0 Grass Valley Rd Unit 210001585
- 0 Grass Valley Rd Unit 190016164
- 0 Grass Valley Rd Unit 190009916
- 3075 Valley Way
- 3090 Windy Way
- 3050 Sunny Dr
- 3125 Middle Way
- 3110 Windy Way