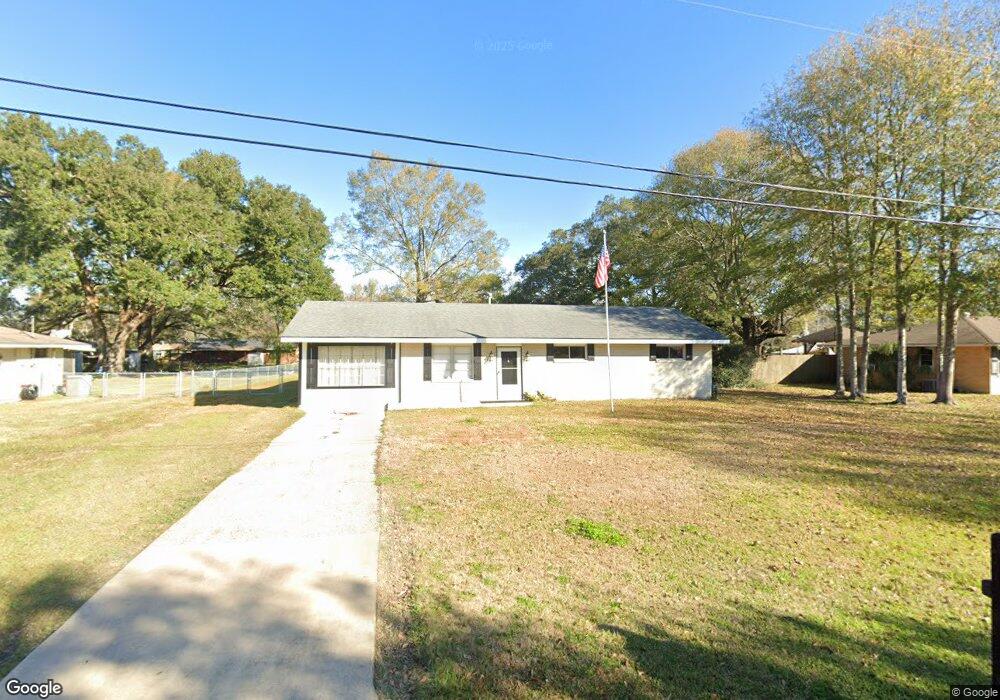
4061 Cherry St Zachary, LA 70791
Estimated Value: $128,000 - $183,000
--
Bed
--
Bath
1,375
Sq Ft
$119/Sq Ft
Est. Value
About This Home
This home is located at 4061 Cherry St, Zachary, LA 70791 and is currently estimated at $163,488, approximately $118 per square foot. 4061 Cherry St is a home located in East Baton Rouge Parish with nearby schools including Zachary Elementary School, Rollins Place Elementary School, and Northwestern Elementary School.
Ownership History
Date
Name
Owned For
Owner Type
Purchase Details
Closed on
Feb 29, 2024
Sold by
Zito Mark Allan and Zito Loren Latil
Bought by
Mcgraw Bobby Joe
Current Estimated Value
Home Financials for this Owner
Home Financials are based on the most recent Mortgage that was taken out on this home.
Original Mortgage
$129,292
Outstanding Balance
$127,129
Interest Rate
6.6%
Mortgage Type
New Conventional
Estimated Equity
$36,359
Purchase Details
Closed on
Sep 14, 2012
Sold by
Latil Wanmda K C
Bought by
Zito Mark A
Home Financials for this Owner
Home Financials are based on the most recent Mortgage that was taken out on this home.
Original Mortgage
$40,000
Interest Rate
3.59%
Mortgage Type
New Conventional
Purchase Details
Closed on
Sep 5, 2012
Sold by
Latil Charles D
Bought by
Latil Wanda K C
Home Financials for this Owner
Home Financials are based on the most recent Mortgage that was taken out on this home.
Original Mortgage
$40,000
Interest Rate
3.59%
Mortgage Type
New Conventional
Create a Home Valuation Report for This Property
The Home Valuation Report is an in-depth analysis detailing your home's value as well as a comparison with similar homes in the area
Home Values in the Area
Average Home Value in this Area
Purchase History
| Date | Buyer | Sale Price | Title Company |
|---|---|---|---|
| Mcgraw Bobby Joe | $125,000 | None Listed On Document | |
| Zito Mark A | $50,000 | -- | |
| Latil Wanda K C | -- | -- |
Source: Public Records
Mortgage History
| Date | Status | Borrower | Loan Amount |
|---|---|---|---|
| Open | Mcgraw Bobby Joe | $129,292 | |
| Previous Owner | Zito Mark A | $40,000 |
Source: Public Records
Tax History Compared to Growth
Tax History
| Year | Tax Paid | Tax Assessment Tax Assessment Total Assessment is a certain percentage of the fair market value that is determined by local assessors to be the total taxable value of land and additions on the property. | Land | Improvement |
|---|---|---|---|---|
| 2024 | $527 | $11,330 | $1,100 | $10,230 |
| 2023 | $527 | $11,330 | $1,100 | $10,230 |
| 2022 | $1,421 | $11,330 | $1,100 | $10,230 |
| 2021 | $1,421 | $11,330 | $1,100 | $10,230 |
| 2020 | $1,434 | $11,330 | $1,100 | $10,230 |
| 2019 | $1,434 | $10,300 | $1,000 | $9,300 |
| 2018 | $1,439 | $10,300 | $1,000 | $9,300 |
| 2017 | $1,439 | $10,300 | $1,000 | $9,300 |
| 2016 | $1,409 | $10,300 | $1,000 | $9,300 |
| 2015 | $1,082 | $8,050 | $1,000 | $7,050 |
| 2014 | $1,079 | $8,050 | $1,000 | $7,050 |
| 2013 | -- | $8,050 | $1,000 | $7,050 |
Source: Public Records
Map
Nearby Homes
- 4133 Chestnut St
- 4286 39th St
- 3952 Chestnut St
- 4076 Bennett St
- 3936 Hancock St
- 3689 Ramey Dr
- 4464 New Weis Rd
- 4608 40th St
- 3350 39th St
- 3620 Church St
- 4848 Lois Dr
- 3215 White Oak St
- 4311 Locke St
- 3110 Ramey Dr
- 3679 E Meadow Ct
- 3160 Louisiana 19
- 3620 Cypress Park Dr
- 5158 Myrtle Hill Ave
- N-2-B Milldale Rd
- N-2-A Milldale Rd