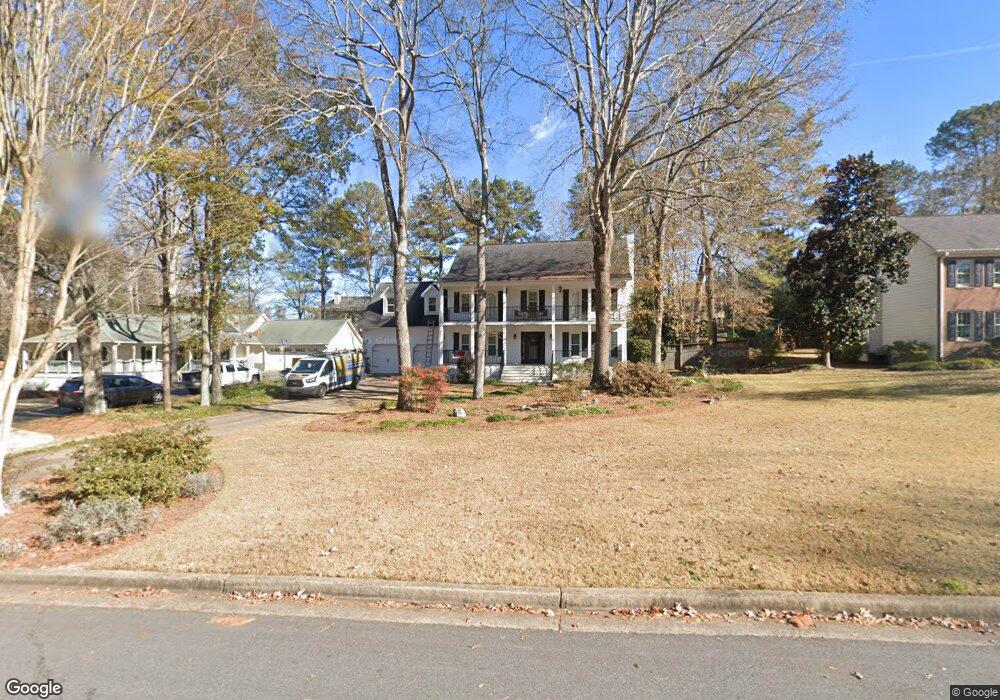
4061 Dover Ave Alpharetta, GA 30009
Estimated Value: $802,000 - $866,000
4
Beds
3
Baths
2,263
Sq Ft
$370/Sq Ft
Est. Value
About This Home
This home is located at 4061 Dover Ave, Alpharetta, GA 30009 and is currently estimated at $836,598, approximately $369 per square foot. 4061 Dover Ave is a home located in Fulton County with nearby schools including Alpharetta Elementary School, Hopewell Middle School, and Cambridge High School.
Ownership History
Date
Name
Owned For
Owner Type
Purchase Details
Closed on
Oct 22, 2014
Sold by
Eastham Jane M
Bought by
Eastham Jane M and Dapper John A
Current Estimated Value
Home Financials for this Owner
Home Financials are based on the most recent Mortgage that was taken out on this home.
Original Mortgage
$107,500
Outstanding Balance
$82,897
Interest Rate
4.26%
Mortgage Type
New Conventional
Estimated Equity
$753,701
Purchase Details
Closed on
Jun 12, 2001
Sold by
Witkowski John J and Witkowski Beth P
Bought by
Eastham Jane M
Home Financials for this Owner
Home Financials are based on the most recent Mortgage that was taken out on this home.
Original Mortgage
$150,000
Interest Rate
7.14%
Mortgage Type
New Conventional
Purchase Details
Closed on
Mar 17, 1998
Sold by
Gilmer Eric E and Gilmer Jill
Bought by
Witkowski John J and Witkowski Beth
Home Financials for this Owner
Home Financials are based on the most recent Mortgage that was taken out on this home.
Original Mortgage
$163,850
Interest Rate
7.01%
Mortgage Type
New Conventional
Create a Home Valuation Report for This Property
The Home Valuation Report is an in-depth analysis detailing your home's value as well as a comparison with similar homes in the area
Home Values in the Area
Average Home Value in this Area
Purchase History
| Date | Buyer | Sale Price | Title Company |
|---|---|---|---|
| Eastham Jane M | -- | -- | |
| Eastham Jane M | $210,000 | -- | |
| Witkowski John J | $172,500 | -- |
Source: Public Records
Mortgage History
| Date | Status | Borrower | Loan Amount |
|---|---|---|---|
| Open | Eastham Jane M | $107,500 | |
| Previous Owner | Eastham Jane M | $150,000 | |
| Previous Owner | Witkowski John J | $163,850 |
Source: Public Records
Tax History Compared to Growth
Tax History
| Year | Tax Paid | Tax Assessment Tax Assessment Total Assessment is a certain percentage of the fair market value that is determined by local assessors to be the total taxable value of land and additions on the property. | Land | Improvement |
|---|---|---|---|---|
| 2025 | $712 | $252,880 | $59,760 | $193,120 |
| 2023 | $712 | $265,960 | $68,840 | $197,120 |
| 2022 | $3,194 | $212,760 | $42,080 | $170,680 |
| 2021 | $3,783 | $196,200 | $32,320 | $163,880 |
| 2020 | $3,782 | $177,800 | $37,880 | $139,920 |
| 2019 | $617 | $190,320 | $22,320 | $168,000 |
| 2018 | $4,119 | $185,880 | $21,800 | $164,080 |
| 2017 | $3,127 | $126,040 | $25,480 | $100,560 |
| 2016 | $3,110 | $126,040 | $25,480 | $100,560 |
| 2015 | $3,646 | $126,040 | $25,480 | $100,560 |
| 2014 | $2,145 | $82,720 | $16,720 | $66,000 |
Source: Public Records
Map
Nearby Homes
- 406 Woodliff Place
- 4016 Dover Ave
- 115 Baxley Ln
- 2100 Providence Oaks St
- 165 Oakhurst Leaf Dr Unit 4
- 141 North Trace
- 4110 Providence Square
- 2644 Vintage Dr
- 2632 Vintage Dr Unit 9
- 925 Pebblestone Ct
- 1895 Henley Way
- 150 Cobblestone Way
- 1835 Henley Way
- 5610 Surrey Ct
- 842 N Brookshade Pkwy
- 1045 Winthrope Chase Dr
- 295 Pebble Trail
- 2445 Lunetta Ln
- 4057 Dover Ave
- 144 Lantern Ridge Ct Unit 2
- 4053 Dover Ave
- 12762 Donegal Ln
- 12752 Donegal Ln
- 12772 Donegal Ln
- 149 Lantern Ridge Ct Unit 2
- 4062 Dover Ave
- 0 Lantern Ridge Ct Unit 7488751
- 0 Lantern Ridge Ct Unit 7239914
- 0 Lantern Ridge Ct Unit 7254677
- 0 Lantern Ridge Ct Unit 7242660
- 0 Lantern Ridge Ct Unit 7193897
- 0 Lantern Ridge Ct Unit 8778749
- 0 Lantern Ridge Ct Unit 8406497
- 0 Lantern Ridge Ct Unit 3201837
- 0 Lantern Ridge Ct Unit 7166662
- 0 Lantern Ridge Ct Unit 3141212
- 0 Lantern Ridge Ct
- 4058 Dover Ave