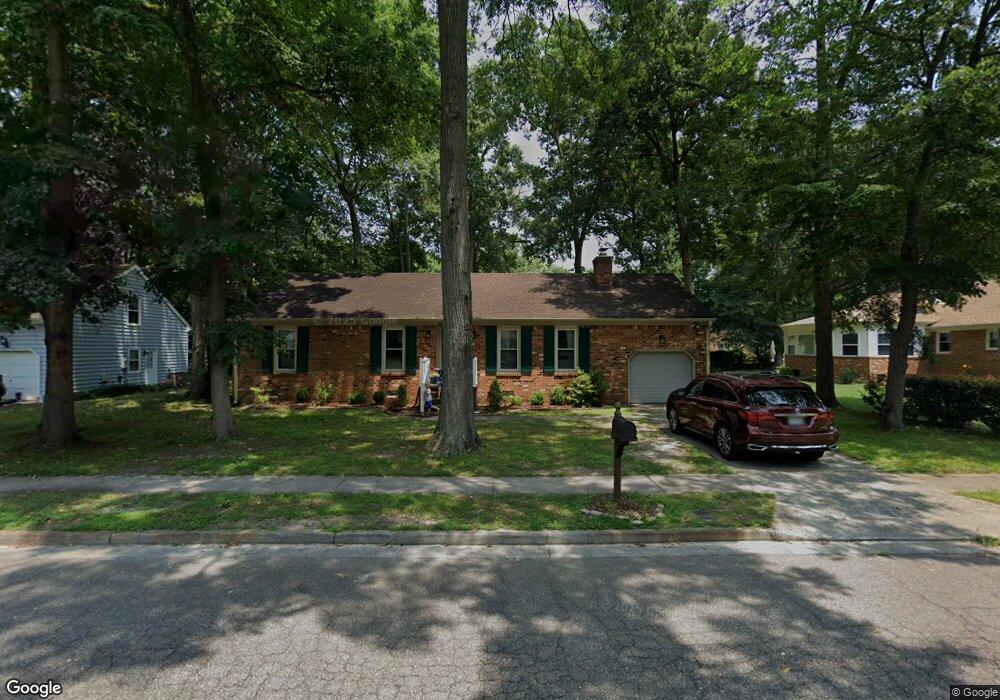
4061 Kalona Rd Portsmouth, VA 23703
Churchland NeighborhoodEstimated Value: $332,813 - $358,000
4
Beds
2
Baths
1,550
Sq Ft
$224/Sq Ft
Est. Value
About This Home
This home is located at 4061 Kalona Rd, Portsmouth, VA 23703 and is currently estimated at $346,703, approximately $223 per square foot. 4061 Kalona Rd is a home located in Portsmouth City with nearby schools including Churchland Primary/Intermediate School, Churchland Middle School, and Churchland High School.
Ownership History
Date
Name
Owned For
Owner Type
Purchase Details
Closed on
Sep 14, 2022
Sold by
Kyle Weiss
Bought by
Terry Kevin B and Terry Miriam A
Current Estimated Value
Home Financials for this Owner
Home Financials are based on the most recent Mortgage that was taken out on this home.
Original Mortgage
$143,950
Outstanding Balance
$137,035
Interest Rate
4.99%
Mortgage Type
New Conventional
Estimated Equity
$209,669
Purchase Details
Closed on
Oct 5, 2016
Sold by
Hobbs Robert V and Hobbs Catherine M
Bought by
Weiss Kyle and Weiss Chelsey
Home Financials for this Owner
Home Financials are based on the most recent Mortgage that was taken out on this home.
Original Mortgage
$181,157
Interest Rate
3.87%
Mortgage Type
FHA
Purchase Details
Closed on
Mar 27, 2008
Sold by
Roche William E
Bought by
Hobbs Robert
Home Financials for this Owner
Home Financials are based on the most recent Mortgage that was taken out on this home.
Original Mortgage
$191,800
Interest Rate
5.76%
Mortgage Type
FHA
Create a Home Valuation Report for This Property
The Home Valuation Report is an in-depth analysis detailing your home's value as well as a comparison with similar homes in the area
Home Values in the Area
Average Home Value in this Area
Purchase History
| Date | Buyer | Sale Price | Title Company |
|---|---|---|---|
| Terry Kevin B | $287,900 | Advance Title & Abstract | |
| Weiss Kyle | $184,500 | Shaffer Settlements Inc | |
| Hobbs Robert | $210,000 | -- |
Source: Public Records
Mortgage History
| Date | Status | Borrower | Loan Amount |
|---|---|---|---|
| Open | Terry Kevin B | $143,950 | |
| Previous Owner | Weiss Kyle | $181,157 | |
| Previous Owner | Hobbs Robert | $191,800 |
Source: Public Records
Tax History Compared to Growth
Tax History
| Year | Tax Paid | Tax Assessment Tax Assessment Total Assessment is a certain percentage of the fair market value that is determined by local assessors to be the total taxable value of land and additions on the property. | Land | Improvement |
|---|---|---|---|---|
| 2025 | $3,858 | $307,960 | $73,500 | $234,460 |
| 2024 | $3,858 | $299,750 | $73,500 | $226,250 |
| 2023 | $3,671 | $280,030 | $73,500 | $206,530 |
| 2022 | $2,805 | $215,750 | $61,250 | $154,500 |
| 2021 | $2,562 | $197,040 | $49,390 | $147,650 |
| 2020 | $2,495 | $191,950 | $47,040 | $144,910 |
| 2019 | $2,406 | $185,110 | $47,040 | $138,070 |
| 2018 | $2,406 | $185,110 | $47,040 | $138,070 |
| 2017 | $2,406 | $185,110 | $47,040 | $138,070 |
| 2016 | $2,249 | $173,010 | $47,040 | $125,970 |
| 2015 | $2,249 | $173,010 | $47,040 | $125,970 |
| 2014 | $2,197 | $173,010 | $47,040 | $125,970 |
Source: Public Records
Map
Nearby Homes
- 3433 Willow Breeze Dr
- 5806 Fawkes St
- 5807 Dunkin St
- 3604 Lilac Dr
- 3616 Bowden St
- 4008 Oakhurst Rd
- 5911 Dunkirk St
- 4100 Mayfair Way
- 4028 Swannanoa Dr
- 6015 Arthur Ave
- 4200 Quince Rd
- 3860 Sugar Creek Cir
- 6002 Campbell St
- 3660B Towne Point Rd Unit A
- 3866 Augustine Cir
- 3604 Pierce St
- 5516 Bingham Dr
- 6205 Dunkirk St
- 3315 Camellia Dr
- 4224 Burnham Dr
- 4057 Kalona Rd
- 3932 Merrifields Blvd
- 5401 Greenbrook Dr
- 3936 Merrifields Blvd
- 4052 Kalona Rd
- 5405 Greenbrook Dr
- 4053 Kalona Rd
- 4048 Kalona Rd
- 4056 Kalona Rd
- 5409 Greenbrook Dr
- 4101 Kalona Rd
- 4044 Kalona Rd
- 7 Wyngate Ct
- 8 Kalona Ct
- 3924 Merrifields Blvd
- 4100 Kalona Rd
- 5413 Greenbrook Dr
- 4000 Merrifields Blvd
- 5400 Greenbrook Dr
- 6 Kalona Ct