4061 Veatch Rd Gambier, OH 43022
Estimated Value: $397,000 - $501,568
3
Beds
3
Baths
2,064
Sq Ft
$215/Sq Ft
Est. Value
About This Home
This home is located at 4061 Veatch Rd, Gambier, OH 43022 and is currently estimated at $444,142, approximately $215 per square foot. 4061 Veatch Rd is a home with nearby schools including Utica High School.
Ownership History
Date
Name
Owned For
Owner Type
Purchase Details
Closed on
Aug 26, 2021
Sold by
Ivanoff Martin L
Bought by
Copenhaver Aaron R and Copenhaver Lani
Current Estimated Value
Home Financials for this Owner
Home Financials are based on the most recent Mortgage that was taken out on this home.
Original Mortgage
$258,000
Outstanding Balance
$237,290
Interest Rate
4.5%
Mortgage Type
Adjustable Rate Mortgage/ARM
Estimated Equity
$206,852
Purchase Details
Closed on
Apr 9, 2021
Sold by
Ivanoff Martin L
Bought by
Ivanoff Martin L and Copenhavee Aaron R
Purchase Details
Closed on
Nov 7, 2014
Sold by
Kohler Dieter Paul and Kohler Dieter P
Bought by
Ivanoff Martin L and Ivanoff Tina D
Purchase Details
Closed on
Dec 6, 2004
Sold by
Bowen Jobie Eric
Bought by
Leibrand-Kohler Carmen Marie and Leibrand-Kohler Kohl
Purchase Details
Closed on
Jan 9, 2002
Bought by
Bowen Jobie Eric
Purchase Details
Closed on
Jun 2, 1998
Bought by
Countrytyme Grove City Lt
Create a Home Valuation Report for This Property
The Home Valuation Report is an in-depth analysis detailing your home's value as well as a comparison with similar homes in the area
Purchase History
| Date | Buyer | Sale Price | Title Company |
|---|---|---|---|
| Copenhaver Aaron R | -- | None Available | |
| Ivanoff Martin L | -- | None Available | |
| Ivanoff Tina D | -- | None Available | |
| Ivanoff Martin L | $16,500 | None Available | |
| Leibrand-Kohler Carmen Marie | $20,000 | -- | |
| Bowen Jobie Eric | $19,900 | -- | |
| Countrytyme Grove City Lt | -- | -- |
Source: Public Records
Mortgage History
| Date | Status | Borrower | Loan Amount |
|---|---|---|---|
| Open | Copenhaver Aaron R | $258,000 |
Source: Public Records
Tax History
| Year | Tax Paid | Tax Assessment Tax Assessment Total Assessment is a certain percentage of the fair market value that is determined by local assessors to be the total taxable value of land and additions on the property. | Land | Improvement |
|---|---|---|---|---|
| 2025 | $4,366 | $127,940 | $19,770 | $108,170 |
| 2024 | $4,366 | $127,940 | $19,770 | $108,170 |
| 2023 | $4,604 | $127,940 | $19,770 | $108,170 |
| 2022 | $194 | $88,230 | $13,630 | $74,600 |
| 2021 | $194 | $4,560 | $4,560 | $0 |
| 2020 | $182 | $4,560 | $4,560 | $0 |
| 2019 | $135 | $3,140 | $3,140 | $0 |
| 2018 | $132 | $3,140 | $3,140 | $0 |
| 2017 | $139 | $3,140 | $3,140 | $0 |
| 2016 | $117 | $2,730 | $2,730 | $0 |
| 2015 | $119 | $2,730 | $2,730 | $0 |
| 2014 | $112 | $2,730 | $2,730 | $0 |
| 2013 | $108 | $2,390 | $2,390 | $0 |
Source: Public Records
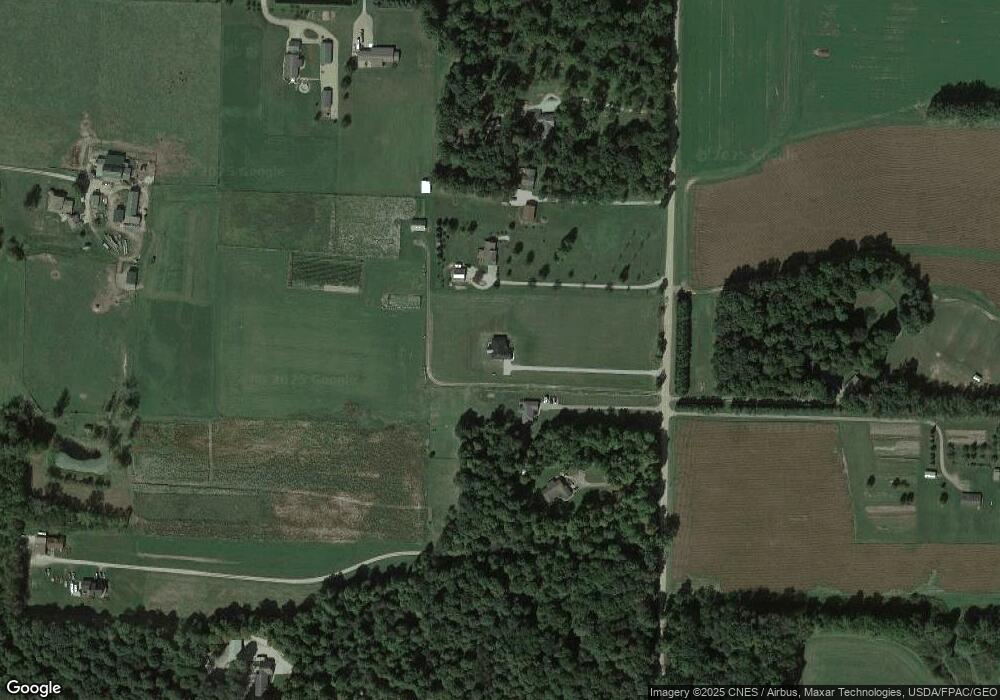
Map
Nearby Homes
- 3200 Millersburg Rd
- 4129 Grove Church Rd
- 20297 Arrington Rd
- 8381 Horn Rd
- 0 Bone Road Lot#2
- 0 Jug Run Rd Unit 5181959
- 0 Jug Run Rd Unit LotWP001
- 0 Jug Run Rd Unit 224006737
- 0 Bone Road Lot#3
- 0 Bone Road Lot#4
- 0 Bone Road Lot#5
- 0 Bone Road Lot#7
- 0 Bone Road Lot#8
- 0 Bone Rd Unit Lot 5 225028400
- 0 Bone Rd Unit Lot 3 225028401
- 0 Bone Rd Unit Lot 7 225028405
- 0 Bone Rd Unit Lot 8 225028406
- 0 Purity Rd Unit 225038778
- 0 Rocky Fork Rd
- VL Jug Run Rd
Your Personal Tour Guide
Ask me questions while you tour the home.