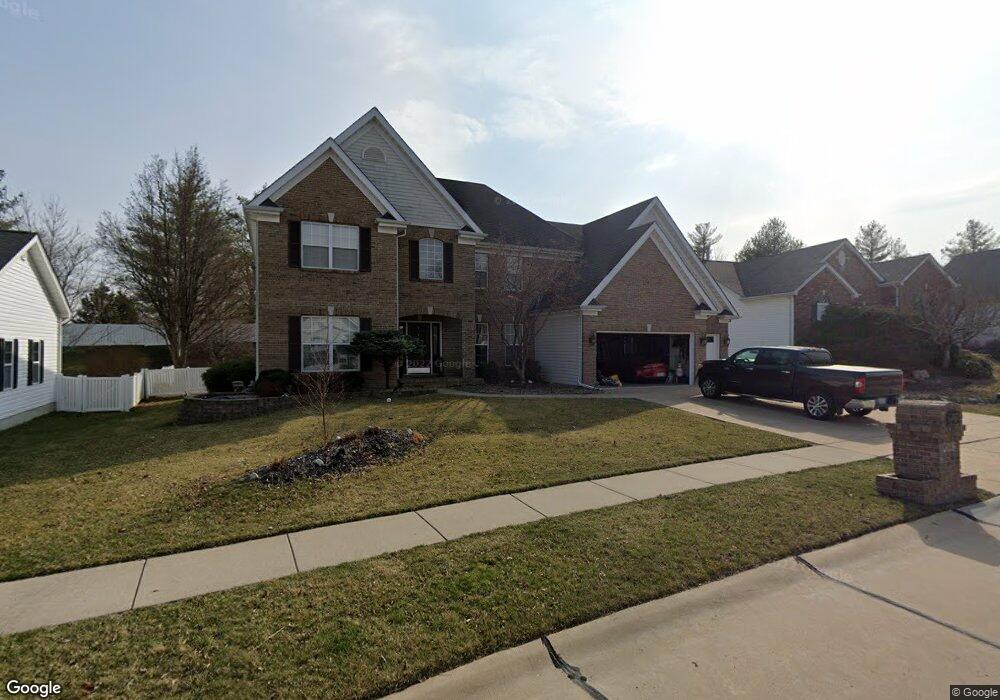
4063 Jacobs Landing Saint Charles, MO 63304
Estimated Value: $516,000 - $657,000
4
Beds
4
Baths
3,052
Sq Ft
$193/Sq Ft
Est. Value
About This Home
This home is located at 4063 Jacobs Landing, Saint Charles, MO 63304 and is currently estimated at $588,611, approximately $192 per square foot. 4063 Jacobs Landing is a home located in St. Charles County with nearby schools including Independence Elementary School, Bryan Middle School, and Francis Howell Union High School.
Ownership History
Date
Name
Owned For
Owner Type
Purchase Details
Closed on
Jun 27, 2008
Sold by
Ras Closing Services Llc
Bought by
Johnson Steven E
Current Estimated Value
Purchase Details
Closed on
May 6, 2008
Sold by
Burnett Gerald W and Burnett Janet L
Bought by
Ras Closing Services Llc
Purchase Details
Closed on
Mar 15, 2004
Sold by
Burnett Gerald W and Burnett Janet L
Bought by
Burnett Gerald W and Burnett Janet L
Purchase Details
Closed on
Jul 2, 1999
Sold by
Frank E Jackson Inc
Bought by
Burnett Gerald W and Burnett Janet L
Home Financials for this Owner
Home Financials are based on the most recent Mortgage that was taken out on this home.
Original Mortgage
$204,500
Interest Rate
7.21%
Mortgage Type
Balloon
Purchase Details
Closed on
Jan 8, 1999
Sold by
C L Investment Company
Bought by
Frank E Jackson Inc and Jackson Homes
Home Financials for this Owner
Home Financials are based on the most recent Mortgage that was taken out on this home.
Original Mortgage
$189,200
Interest Rate
6.66%
Create a Home Valuation Report for This Property
The Home Valuation Report is an in-depth analysis detailing your home's value as well as a comparison with similar homes in the area
Home Values in the Area
Average Home Value in this Area
Purchase History
| Date | Buyer | Sale Price | Title Company |
|---|---|---|---|
| Johnson Steven E | -- | Etc | |
| Ras Closing Services Llc | $415,000 | Etc | |
| Burnett Gerald W | -- | -- | |
| Burnett Gerald W | -- | -- | |
| Frank E Jackson Inc | -- | -- |
Source: Public Records
Mortgage History
| Date | Status | Borrower | Loan Amount |
|---|---|---|---|
| Previous Owner | Burnett Gerald W | $204,500 | |
| Previous Owner | Frank E Jackson Inc | $189,200 |
Source: Public Records
Tax History Compared to Growth
Tax History
| Year | Tax Paid | Tax Assessment Tax Assessment Total Assessment is a certain percentage of the fair market value that is determined by local assessors to be the total taxable value of land and additions on the property. | Land | Improvement |
|---|---|---|---|---|
| 2025 | $5,398 | $100,283 | -- | -- |
| 2023 | $5,346 | $90,576 | $0 | $0 |
| 2022 | $4,616 | $71,942 | $0 | $0 |
| 2021 | $4,620 | $71,942 | $0 | $0 |
| 2020 | $5,135 | $77,447 | $0 | $0 |
| 2019 | $5,111 | $77,447 | $0 | $0 |
| 2018 | $4,561 | $66,026 | $0 | $0 |
| 2017 | $4,523 | $66,026 | $0 | $0 |
| 2016 | $4,034 | $62,401 | $0 | $0 |
| 2015 | $4,401 | $62,401 | $0 | $0 |
| 2014 | $4,622 | $63,568 | $0 | $0 |
Source: Public Records
Map
Nearby Homes
- 74 Mondavi Ct
- 64 Castle Bluff Dr
- 3928 Rhine Ct
- 502 Beneficial Way
- 3724 Cambridge Crossing Dr
- 3805 Chardonnay Ct
- 354 Healthy Way
- 517 Beneficial Way
- 4227 Towers Rd
- 1012 Harvest Home Cir
- 437 Muirfield Dr
- 4211 Georgian Oaks Ct
- 161 Cross Timbers Ct
- 544 Muirfield Dr
- 17 Greens Bottom Rd
- 1040 Dingledine Manor Ct
- 114 Greenstone Dr
- 3924 Cambridge Crossing Dr
- 226 Muirfield Woods Ct
- 4304 Austin Pass Ct
- 4059 Jacobs Landing
- 4067 Jacobs Landing
- 4055 Jacobs Landing
- 56 Rayfield Ln
- 56 Rayfield Dr
- 4071 Jacobs Landing
- 4072 Jacobs Landing
- 60 Rayfield Dr
- 4045 Jacobs Landing
- 52 Rayfield Dr
- 4068 Jacobs Landing
- 4062 Jacobs Landing
- 4075 Jacobs Landing
- 4076 Jacobs Landing
- 4035 Jacobs Landing
- 4056 Jacobs Landing
- 4080 Jacobs Landing
- 4050 Jacobs Landing
- 4025 Jacobs Landing
- 4079 Jacobs Landing