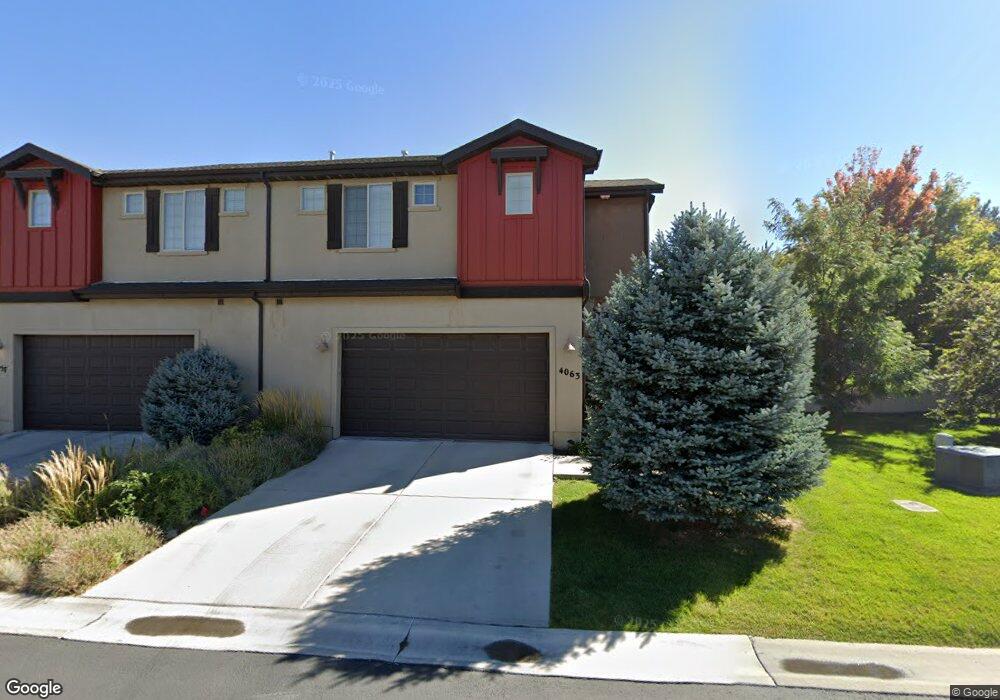
4063 S Olivia View Ln Salt Lake City, UT 84107
Estimated Value: $549,000 - $695,000
3
Beds
3
Baths
2,397
Sq Ft
$263/Sq Ft
Est. Value
About This Home
This home is located at 4063 S Olivia View Ln, Salt Lake City, UT 84107 and is currently estimated at $629,612, approximately $262 per square foot. 4063 S Olivia View Ln is a home located in Salt Lake County with nearby schools including James E Moss Elementary School, Twin Peaks Elementary School, and Bonneville Junior High School.
Ownership History
Date
Name
Owned For
Owner Type
Purchase Details
Closed on
May 30, 2018
Sold by
Sampson Linda R and Mitchell Adriana
Bought by
Varanakis Mike N and Sampson Candace M
Current Estimated Value
Home Financials for this Owner
Home Financials are based on the most recent Mortgage that was taken out on this home.
Original Mortgage
$308,500
Outstanding Balance
$266,198
Interest Rate
4.4%
Mortgage Type
New Conventional
Estimated Equity
$363,415
Purchase Details
Closed on
Sep 6, 2011
Sold by
Mitchell Anthony W
Bought by
Mitchell Adriana and Sampson Linda R
Purchase Details
Closed on
Nov 24, 2010
Sold by
Woodland Cove Estates Llc
Bought by
Mitchell Anthony W and Sampson Linda R
Home Financials for this Owner
Home Financials are based on the most recent Mortgage that was taken out on this home.
Original Mortgage
$240,000
Interest Rate
4.16%
Mortgage Type
New Conventional
Create a Home Valuation Report for This Property
The Home Valuation Report is an in-depth analysis detailing your home's value as well as a comparison with similar homes in the area
Home Values in the Area
Average Home Value in this Area
Purchase History
| Date | Buyer | Sale Price | Title Company |
|---|---|---|---|
| Varanakis Mike N | -- | First American Title Ins | |
| Mitchell Adriana | -- | None Available | |
| Mitchell Anthony W | -- | Secure Title Insur Agency |
Source: Public Records
Mortgage History
| Date | Status | Borrower | Loan Amount |
|---|---|---|---|
| Open | Varanakis Mike N | $308,500 | |
| Closed | Mitchell Anthony W | $240,000 |
Source: Public Records
Tax History Compared to Growth
Tax History
| Year | Tax Paid | Tax Assessment Tax Assessment Total Assessment is a certain percentage of the fair market value that is determined by local assessors to be the total taxable value of land and additions on the property. | Land | Improvement |
|---|---|---|---|---|
| 2025 | $3,761 | $634,100 | $201,600 | $432,500 |
| 2024 | $3,761 | $585,600 | $195,400 | $390,200 |
| 2023 | $3,840 | $567,300 | $176,000 | $391,300 |
| 2022 | $3,822 | $578,100 | $123,100 | $455,000 |
| 2021 | $3,636 | $476,700 | $94,700 | $382,000 |
| 2020 | $3,571 | $442,700 | $92,100 | $350,600 |
| 2019 | $3,594 | $435,000 | $87,500 | $347,500 |
| 2018 | $3,246 | $378,200 | $87,500 | $290,700 |
| 2017 | $2,941 | $358,800 | $87,500 | $271,300 |
| 2016 | $2,636 | $325,200 | $87,500 | $237,700 |
| 2015 | $2,752 | $309,400 | $84,900 | $224,500 |
| 2014 | $2,601 | $293,800 | $83,100 | $210,700 |
Source: Public Records
Map
Nearby Homes
- 779 E 4070 S
- 830 E 3990 S Unit D
- 825 E 3990 S Unit C
- 3970 S 840 E Unit A
- 3965 S 805 E Unit B
- 832 E 4170 S
- 834 E 4170 S
- 3944 S 900 E Unit 204
- 3944 S 900 E Unit 203
- 842 E 4170 S
- 4356 S 900 E
- 3938 S 805 E Unit A
- 4040 S 685 E Unit F
- 4040 S 685 E Unit F
- 883 E Sydnee View Ln
- 657 E 4065 S Unit C
- 955 E Montana Vista Ln
- 651 E 4025 S Unit G
- 689 E 4149 S
- 883 E Arnecia Ct Unit 31
- 4057 S Olivia View Ln
- 4057 S Olivia View Ln
- 4063 S Olivia View Ln
- 837 E Olivia Ct
- 837 E Olivia Ct
- 4062 S Olivia View Ln
- 4062 S Olivia View Ln
- 4064 S Olivia View Ln
- 4064 S Olivia View Ln
- 4069 S Olivia View Ln
- 4069 S Olivia View Ln Unit 106
- 4069 S Olivia View Ln
- 833 E Olivia Ct
- 4077 S Olivia View Ln
- 4077 S Olivia View Ln
- 829 E Olivia Ct
- 829 E Olivia Ct
- 4072 S Olivia View Ln
- 4072 S Olivia View Ln
- 822 E Olivia Ct