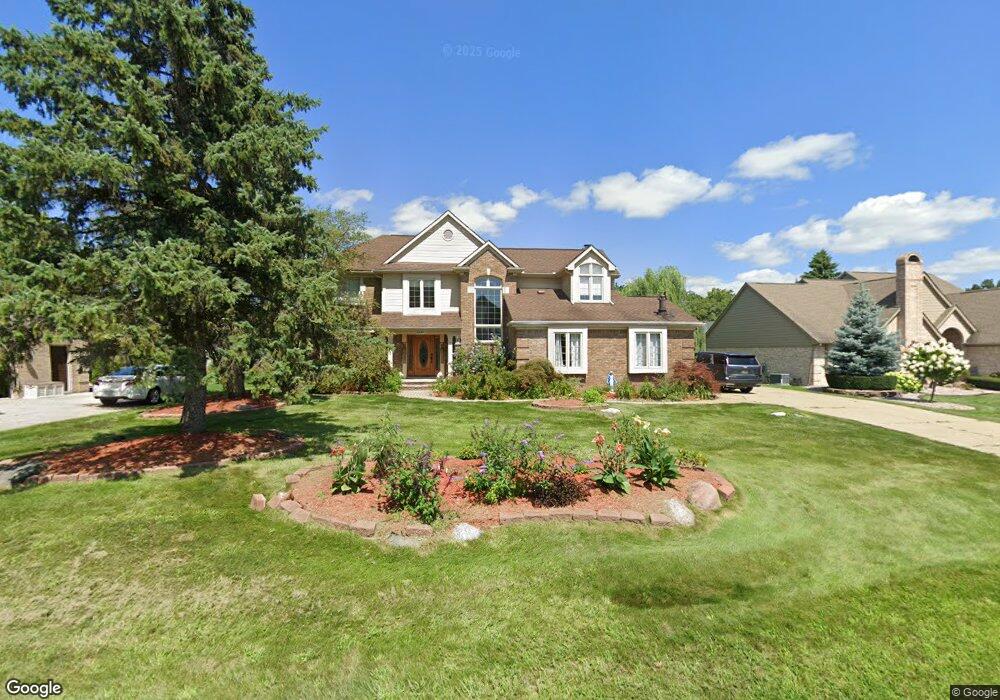
40630 Meadow Trail Unit Bldg-Unit Northville, MI 48168
Estimated Value: $700,329 - $758,000
4
Beds
3
Baths
2,805
Sq Ft
$259/Sq Ft
Est. Value
About This Home
This home is located at 40630 Meadow Trail Unit Bldg-Unit, Northville, MI 48168 and is currently estimated at $726,582, approximately $259 per square foot. 40630 Meadow Trail Unit Bldg-Unit is a home located in Wayne County with nearby schools including Winchester Elementary School, Meads Mill Middle School, and Northville High School.
Ownership History
Date
Name
Owned For
Owner Type
Purchase Details
Closed on
Jan 12, 2018
Sold by
Xi Zhimin and Xu Zhimin
Bought by
Kabani Mohab
Current Estimated Value
Home Financials for this Owner
Home Financials are based on the most recent Mortgage that was taken out on this home.
Original Mortgage
$344,000
Outstanding Balance
$290,295
Interest Rate
3.94%
Mortgage Type
New Conventional
Estimated Equity
$436,287
Purchase Details
Closed on
Aug 25, 2016
Sold by
Xi Zhimin and Lai Xiaoxia
Bought by
Lai Xiaoxia
Home Financials for this Owner
Home Financials are based on the most recent Mortgage that was taken out on this home.
Original Mortgage
$326,000
Interest Rate
3.45%
Mortgage Type
New Conventional
Purchase Details
Closed on
Jun 2, 2011
Sold by
Laing Karen Ann
Bought by
Dodge N P and National Equity Inc
Purchase Details
Closed on
Jul 31, 2000
Sold by
Debra T Locke
Bought by
Karen A Laing
Create a Home Valuation Report for This Property
The Home Valuation Report is an in-depth analysis detailing your home's value as well as a comparison with similar homes in the area
Home Values in the Area
Average Home Value in this Area
Purchase History
| Date | Buyer | Sale Price | Title Company |
|---|---|---|---|
| Kabani Mohab | $430,000 | Liberty Title | |
| Lai Xiaoxia | -- | Etitle Agency | |
| Dodge N P | $275,000 | Stewart Title Guaranty Co | |
| Karen A Laing | $396,000 | -- |
Source: Public Records
Mortgage History
| Date | Status | Borrower | Loan Amount |
|---|---|---|---|
| Open | Kabani Mohab | $344,000 | |
| Previous Owner | Lai Xiaoxia | $326,000 |
Source: Public Records
Tax History Compared to Growth
Tax History
| Year | Tax Paid | Tax Assessment Tax Assessment Total Assessment is a certain percentage of the fair market value that is determined by local assessors to be the total taxable value of land and additions on the property. | Land | Improvement |
|---|---|---|---|---|
| 2025 | $5,483 | $309,200 | $0 | $0 |
| 2024 | $5,483 | $271,500 | $0 | $0 |
| 2023 | $5,232 | $253,700 | $0 | $0 |
| 2022 | $9,175 | $232,000 | $0 | $0 |
| 2021 | $10,152 | $232,800 | $0 | $0 |
| 2020 | $9,578 | $236,600 | $0 | $0 |
| 2019 | $9,317 | $234,900 | $0 | $0 |
| 2018 | $3,628 | $222,300 | $0 | $0 |
| 2017 | $4,961 | $210,200 | $0 | $0 |
| 2016 | $5,928 | $197,900 | $0 | $0 |
| 2015 | $16,413 | $191,400 | $0 | $0 |
| 2013 | $15,900 | $166,000 | $0 | $0 |
| 2012 | $5,285 | $161,400 | $34,100 | $127,300 |
Source: Public Records
Map
Nearby Homes
- 40745 N Northville Trail
- 17018 White Haven Dr
- 16727 Abby Cir
- 16707 Abby Cir
- 16745 Abby Cir
- 16658 Country Knoll Dr
- 39858 Rockcrest Cir Unit 83
- 39574 Village Run Dr Unit 110
- 39675 Springwater Dr
- 39660 Rockcrest Ln Unit 48
- 40053 Bexley Way
- 16252 Country Knoll Dr
- 19191 Maybury Meadow Ct
- 39621 Springwater Dr Unit 84
- 39435 Village Run Dr Unit 235
- 39510 Edgewater Dr Unit 100
- 39568 Dun Rovin Dr Unit 73
- 19234 Windridge Dr
- 42126 Baintree Cir
- 19623 Northridge Dr
- 40630 Meadow Trail
- 40668 Meadow Trail
- 40590 Meadow Trail
- 40631 N Northville Trail
- 40746 Meadow Trail
- 40593 N Northville Trail
- 40669 N Northville Trail
- 40538 Meadow Trail
- 40589 Meadow Trail
- 40541 N Northville Trail
- 40621 Meadow Trail
- 40643 Meadow Trail
- 40784 Meadow Trail
- 40537 Meadow Trail
- 40705 Meadow Trail
- 40535 N Northville Trail
- 40476 Meadow Trail
- 40783 N Northville Trail
- 40747 Meadow Trail
- 40475 Meadow Trail