40637 Grenata Preserve Place Leesburg, VA 20175
Estimated Value: $2,356,000 - $2,568,000
4
Beds
6
Baths
5,460
Sq Ft
$446/Sq Ft
Est. Value
About This Home
This home is located at 40637 Grenata Preserve Place, Leesburg, VA 20175 and is currently estimated at $2,436,076, approximately $446 per square foot. 40637 Grenata Preserve Place is a home located in Loudoun County with nearby schools including Evergreen Mill Elementary School, J. Lupton Simpson Middle School, and Loudoun County High School.
Ownership History
Date
Name
Owned For
Owner Type
Purchase Details
Closed on
Jun 20, 2020
Sold by
Ruparelia Shreyesh Sudhir and Ruparelia Sonya Patel
Bought by
Ruparelia Shreyesh Sudhir and Ruparelia Sonya Patel
Current Estimated Value
Purchase Details
Closed on
Jan 13, 2017
Sold by
Patel Ruparelia Shreyesh S and Patel Ruparelia Sonya
Bought by
The Shreyeh Sudhir Ruparelia Revocable T and The Sonya Patel Ruparelia Revocabel Trus
Purchase Details
Closed on
Dec 27, 2013
Sold by
Creighton Grenata Llc
Bought by
Ruparelia Shreyesh S
Home Financials for this Owner
Home Financials are based on the most recent Mortgage that was taken out on this home.
Original Mortgage
$440,000
Interest Rate
4.35%
Mortgage Type
New Conventional
Purchase Details
Closed on
May 31, 2007
Sold by
Grenata Llc
Bought by
Creighton Grenata Llc
Create a Home Valuation Report for This Property
The Home Valuation Report is an in-depth analysis detailing your home's value as well as a comparison with similar homes in the area
Home Values in the Area
Average Home Value in this Area
Purchase History
| Date | Buyer | Sale Price | Title Company |
|---|---|---|---|
| Ruparelia Shreyesh Sudhir | -- | None Available | |
| The Shreyeh Sudhir Ruparelia Revocable T | -- | None Available | |
| Ruparelia Shreyesh S | $550,000 | -- | |
| Creighton Grenata Llc | $491,812 | -- |
Source: Public Records
Mortgage History
| Date | Status | Borrower | Loan Amount |
|---|---|---|---|
| Previous Owner | Ruparelia Shreyesh S | $440,000 |
Source: Public Records
Tax History Compared to Growth
Tax History
| Year | Tax Paid | Tax Assessment Tax Assessment Total Assessment is a certain percentage of the fair market value that is determined by local assessors to be the total taxable value of land and additions on the property. | Land | Improvement |
|---|---|---|---|---|
| 2025 | $17,307 | $2,149,910 | $630,600 | $1,519,310 |
| 2024 | $18,196 | $2,103,550 | $630,600 | $1,472,950 |
| 2023 | $16,902 | $1,931,640 | $525,600 | $1,406,040 |
| 2022 | $14,843 | $1,667,790 | $450,600 | $1,217,190 |
| 2021 | $14,759 | $1,505,970 | $450,600 | $1,055,370 |
| 2020 | $14,777 | $1,427,760 | $450,600 | $977,160 |
| 2019 | $15,693 | $1,501,720 | $450,600 | $1,051,120 |
| 2018 | $15,643 | $1,441,730 | $450,600 | $991,130 |
| 2017 | $16,015 | $1,423,530 | $450,600 | $972,930 |
| 2016 | $16,773 | $1,464,900 | $0 | $0 |
| 2015 | $5,114 | $0 | $0 | $0 |
| 2014 | $5,843 | $10,000 | $0 | $10,000 |
Source: Public Records
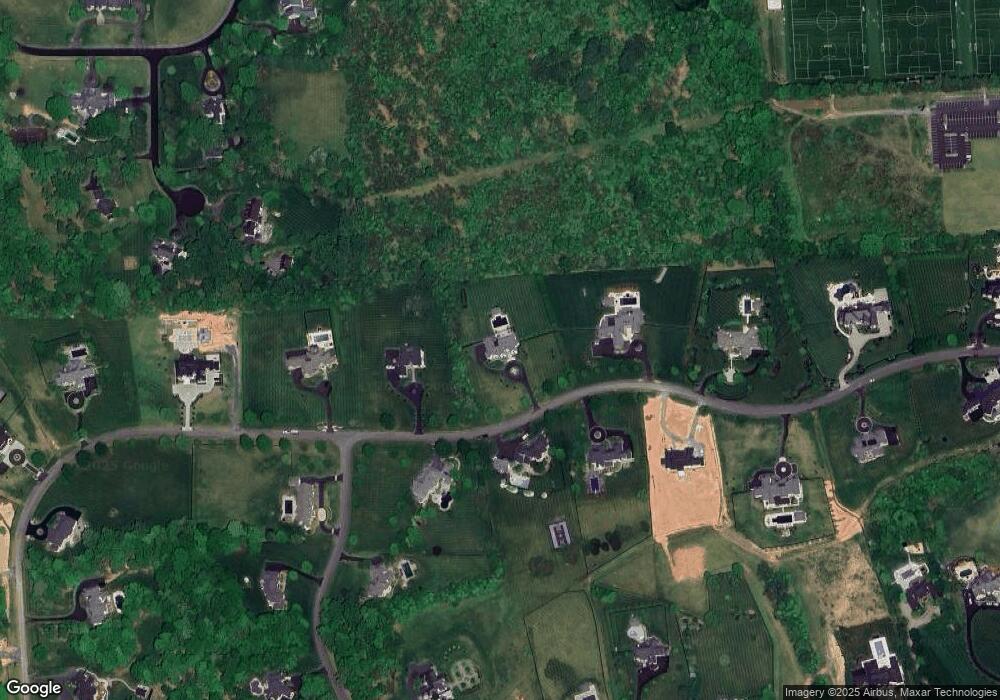
Map
Nearby Homes
- 102 Stoic St SE
- 1508 Woodlea Dr SW
- 131 Goldsworth Terrace SW
- 146 Hampshire Square SW
- 15 Linden Hill Way SW
- 208 Alpine Dr SE
- 348 Pink Azalea Terrace SE
- 161 Alpine Dr SE
- 0 Delta Diamond Ln Unit VALO2107922
- 514 Sunset View Terrace SE Unit 402
- 503 Sunset View Terrace SE Unit 208
- 322 Whipp Dr SE
- 502 Sunset View Terrace SE Unit 107
- 0 Stone Fox Ct Unit VALO2092550
- 0 Stone Fox Ct Unit VALO2092544
- Lot 15B Stone Fox Ct
- 125H Clubhouse Dr SW Unit 4
- 316 Baish Dr SE
- 125 Clubhouse Dr SW Unit 11
- 648 Burnside Terrace SE
- 40661 Grenata Preserve Place
- 40638 Grenata Preserve Place
- 40589 Grenata Preserve Place
- 40614 Grenata Preserve Place
- 40650 Grenata Preserve Place
- 40590 Grenata Preserve Place
- 40679 Grenata Preserve Place
- 40577 Grenata Preserve Place
- 19631 Greenham Dr
- 19648 Greenham Dr
- 19518 Barnwood Ct
- 40715 Grenata Preserve Place
- 40552 Grenata Preserve Place
- 19647 Greenham Dr
- 19702 Greenham Dr
- 41066 Grenata Preserve Place
- 19519 Barnwood Ct
- 40529 Grenata Preserve Place
- 40530 Grenata Preserve Place
- 19510 Barnwood Ct