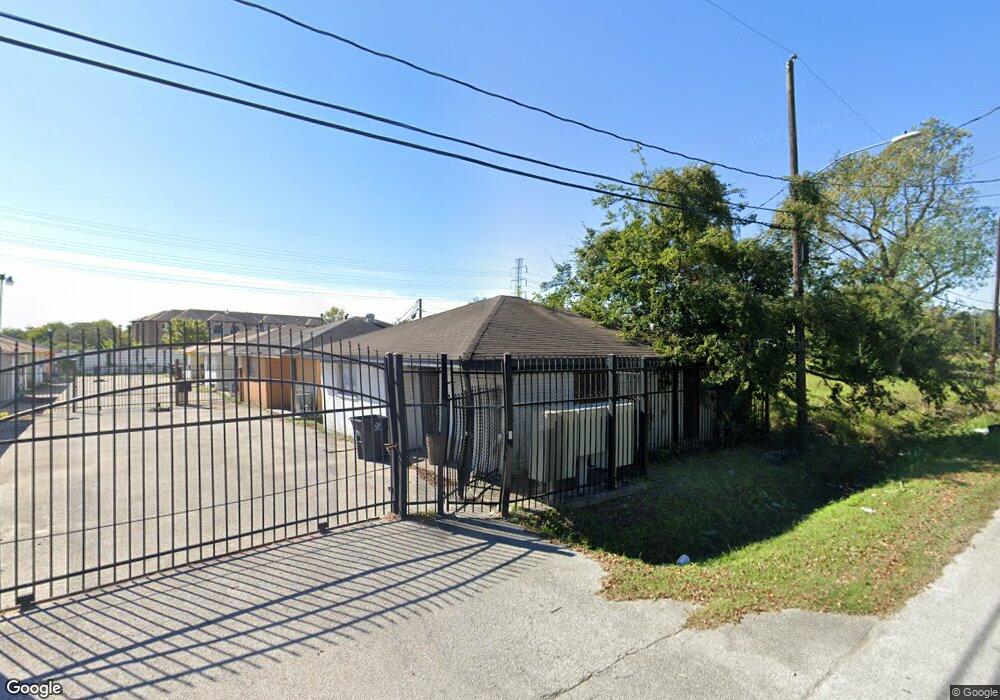
4064 Lynnfield St Houston, TX 77016
Trinity-Houston Gardens NeighborhoodEstimated Value: $69,000 - $944,212
70
Beds
36
Baths
27,459
Sq Ft
$13/Sq Ft
Est. Value
About This Home
This home is located at 4064 Lynnfield St, Houston, TX 77016 and is currently estimated at $362,737, approximately $13 per square foot. 4064 Lynnfield St is a home located in Harris County with nearby schools including Roderick R. Paige Elementary School, Key Middle, and Kashmere High School.
Ownership History
Date
Name
Owned For
Owner Type
Purchase Details
Closed on
Mar 26, 2025
Sold by
Sfcc Ventures Llc
Bought by
Under Control Llc
Current Estimated Value
Purchase Details
Closed on
Mar 25, 2005
Sold by
Betway Lending Lp
Bought by
Betway Parks Lp
Purchase Details
Closed on
Dec 31, 2004
Sold by
Lacy Robert F and Lacy Connie Lee
Bought by
Betway Lending Lp
Create a Home Valuation Report for This Property
The Home Valuation Report is an in-depth analysis detailing your home's value as well as a comparison with similar homes in the area
Home Values in the Area
Average Home Value in this Area
Purchase History
| Date | Buyer | Sale Price | Title Company |
|---|---|---|---|
| Under Control Llc | -- | None Listed On Document | |
| Betway Parks Lp | -- | -- | |
| Betway Lending Lp | -- | -- |
Source: Public Records
Mortgage History
| Date | Status | Borrower | Loan Amount |
|---|---|---|---|
| Closed | Betway Parks Lp | $0 |
Source: Public Records
Tax History Compared to Growth
Tax History
| Year | Tax Paid | Tax Assessment Tax Assessment Total Assessment is a certain percentage of the fair market value that is determined by local assessors to be the total taxable value of land and additions on the property. | Land | Improvement |
|---|---|---|---|---|
| 2025 | $22,533 | $1,027,780 | $274,750 | $753,030 |
| 2024 | $22,533 | $1,145,756 | $274,750 | $871,006 |
| 2023 | $22,533 | $977,833 | $245,000 | $732,833 |
| 2022 | $16,859 | $778,346 | $166,250 | $612,096 |
| 2021 | $13,804 | $596,190 | $131,250 | $464,940 |
| 2020 | $12,352 | $510,086 | $84,000 | $426,086 |
| 2019 | $8,671 | $441,511 | $70,000 | $371,511 |
| 2018 | $6,036 | $311,513 | $42,000 | $269,513 |
| 2017 | $7,877 | $311,513 | $42,000 | $269,513 |
| 2016 | $7,877 | $311,513 | $42,000 | $269,513 |
| 2015 | $7,841 | $305,004 | $33,250 | $271,754 |
| 2014 | $7,841 | $305,004 | $33,250 | $271,754 |
Source: Public Records
Map
Nearby Homes
- 2708 Lynnfield St
- 4103 Lumber Ln
- 3920B Lynnfield St
- 3924 Lynnfield St
- 3916 Lynnfield St
- 3920 Lynnfield St
- 3908 Lynnfield St
- 3912 Lynnfield St
- 3941 Lynnfield St
- 3818 Lynnfield St
- 3911 Dorchester St
- 4126 Dorchester St
- 0 Dorchester St
- 3810 Lynnfield St
- 3721 Bennington St
- 3711 Dorchester St
- 4310 Bennington St
- 3938 King St
- 4322 Bennington St
- 6809 Glass St
- 3925 Lynnfield St
- 3921 Lynnfield St
- 3919 Lynnfield St
- 3927 Lynnfield St
- 3917 Lynnfield St
- 3929 Lynnfield St
- 4018 Lumber Ln
- 3915 Lynnfield St
- 3931 Lynnfield St
- 000 Lynnfield St
- 4006 Lumber Ln
- 4020 Lumber Ln
- 4002 Lumber Ln
- 3913 Lynnfield St
- 4022 Lumber Ln Unit 12
- 3933 Lynnfield St
- 3926 Lumber Ln
- 3911 Lynnfield St
- 4102 Lumber Ln
- 3935 Lynnfield St