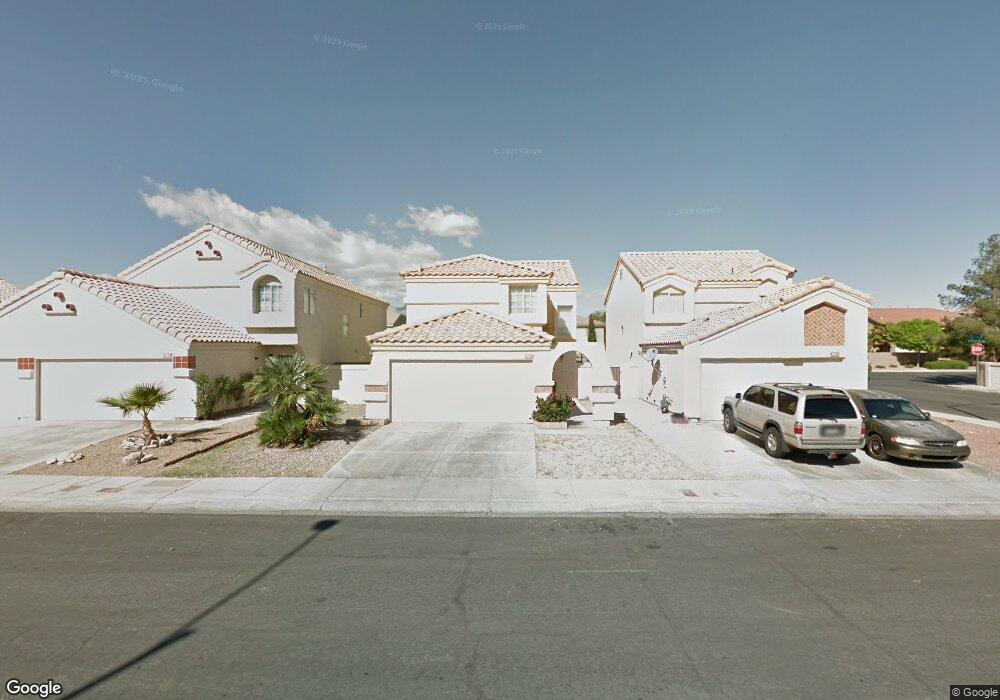
4065 Browndeer Cir Las Vegas, NV 89129
Lone Mountain NeighborhoodEstimated Value: $403,000 - $421,000
3
Beds
3
Baths
1,708
Sq Ft
$239/Sq Ft
Est. Value
About This Home
This home is located at 4065 Browndeer Cir, Las Vegas, NV 89129 and is currently estimated at $408,807, approximately $239 per square foot. 4065 Browndeer Cir is a home located in Clark County with nearby schools including Marc Kahre Elementary School, Dorothy Eisenberg Elementary School, and Justice Myron E Leavitt Middle School.
Ownership History
Date
Name
Owned For
Owner Type
Purchase Details
Closed on
Mar 21, 2002
Sold by
Fairbanks Capital Corp
Bought by
Chow Yeeson C and Chow Eugenia F
Current Estimated Value
Home Financials for this Owner
Home Financials are based on the most recent Mortgage that was taken out on this home.
Original Mortgage
$130,055
Outstanding Balance
$53,601
Interest Rate
6.87%
Estimated Equity
$355,206
Purchase Details
Closed on
Jan 29, 2002
Sold by
Obeso David
Bought by
Fairbanks Capital Corp
Home Financials for this Owner
Home Financials are based on the most recent Mortgage that was taken out on this home.
Original Mortgage
$130,055
Outstanding Balance
$53,601
Interest Rate
6.87%
Estimated Equity
$355,206
Purchase Details
Closed on
Sep 9, 1994
Sold by
First Interstate Bank Of Nevada
Bought by
Ruiz Karla L and Fellers Eleanor A
Home Financials for this Owner
Home Financials are based on the most recent Mortgage that was taken out on this home.
Original Mortgage
$105,879
Interest Rate
8.58%
Mortgage Type
FHA
Purchase Details
Closed on
Apr 19, 1994
Sold by
Trenk Valerie
Bought by
First Interstate Bank Of Nevada
Create a Home Valuation Report for This Property
The Home Valuation Report is an in-depth analysis detailing your home's value as well as a comparison with similar homes in the area
Home Values in the Area
Average Home Value in this Area
Purchase History
| Date | Buyer | Sale Price | Title Company |
|---|---|---|---|
| Chow Yeeson C | $136,900 | First American Title Co | |
| Fairbanks Capital Corp | $112,807 | Land Title | |
| Ruiz Karla L | $108,500 | Land Title | |
| First Interstate Bank Of Nevada | -- | -- |
Source: Public Records
Mortgage History
| Date | Status | Borrower | Loan Amount |
|---|---|---|---|
| Open | Chow Yeeson C | $130,055 | |
| Previous Owner | Ruiz Karla L | $105,879 |
Source: Public Records
Tax History Compared to Growth
Tax History
| Year | Tax Paid | Tax Assessment Tax Assessment Total Assessment is a certain percentage of the fair market value that is determined by local assessors to be the total taxable value of land and additions on the property. | Land | Improvement |
|---|---|---|---|---|
| 2025 | $1,593 | $80,813 | $33,600 | $47,213 |
| 2024 | $1,622 | $80,813 | $33,600 | $47,213 |
| 2023 | $1,622 | $74,106 | $28,700 | $45,406 |
| 2022 | $1,503 | $65,958 | $24,150 | $41,808 |
| 2021 | $1,391 | $61,461 | $21,350 | $40,111 |
| 2020 | $1,289 | $50,636 | $21,000 | $29,636 |
| 2019 | $1,208 | $59,687 | $19,950 | $39,737 |
| 2018 | $1,153 | $53,690 | $15,400 | $38,290 |
| 2017 | $1,750 | $53,382 | $14,350 | $39,032 |
| 2016 | $1,080 | $47,938 | $10,500 | $37,438 |
| 2015 | $1,077 | $41,142 | $9,100 | $32,042 |
| 2014 | $1,046 | $35,364 | $5,950 | $29,414 |
Source: Public Records
Map
Nearby Homes
- 4061 Browndeer Cir
- 7223 Hollywood Park Ave
- 4109 Glenfield Cir
- 4053 Hazelridge Dr
- 4025 Cunning Fellow Ct
- 7251 Daily Double Ave
- 4025 Sea Hero St
- 4021 Sea Hero St Unit 1
- 4224 Perfect Drift St
- 4052 Cape Sand Dr
- 4252 Olympic Point Dr
- 4205 Thunder Twice St
- 3351 Dancing Waters St
- 3344 Dancing Waters St
- 3350 Dancing Waters St
- 7408 Summer Crest Ln
- 4356 Perfect Drift St
- 7415 Constantinople Ave
- 7349 Dolphine Crest Ave
- 6900 Quail Hollow Dr
- 4069 N Browndeer Cir
- 4069 Browndeer Cir
- 4069 Browndeer Cir
- 4057 Browndeer Cir
- 4053 Browndeer Cir
- 4101 Browndeer Cir
- 4064 Browndeer Cir
- 4060 Browndeer Cir
- 4060 Browndeer Cir Unit n/a
- 4068 Browndeer Cir
- 4049 Browndeer Cir
- 4049 N Browndeer Cir
- 4056 Browndeer Cir
- 4105 Browndeer Cir Unit 1
- 4105 Browndeer Cir
- 4052 N Browndeer Cir
- 4060 Perfect Lure St
- 4052 Browndeer Cir
- 4056 Perfect Lure St
- 4045 Browndeer Cir