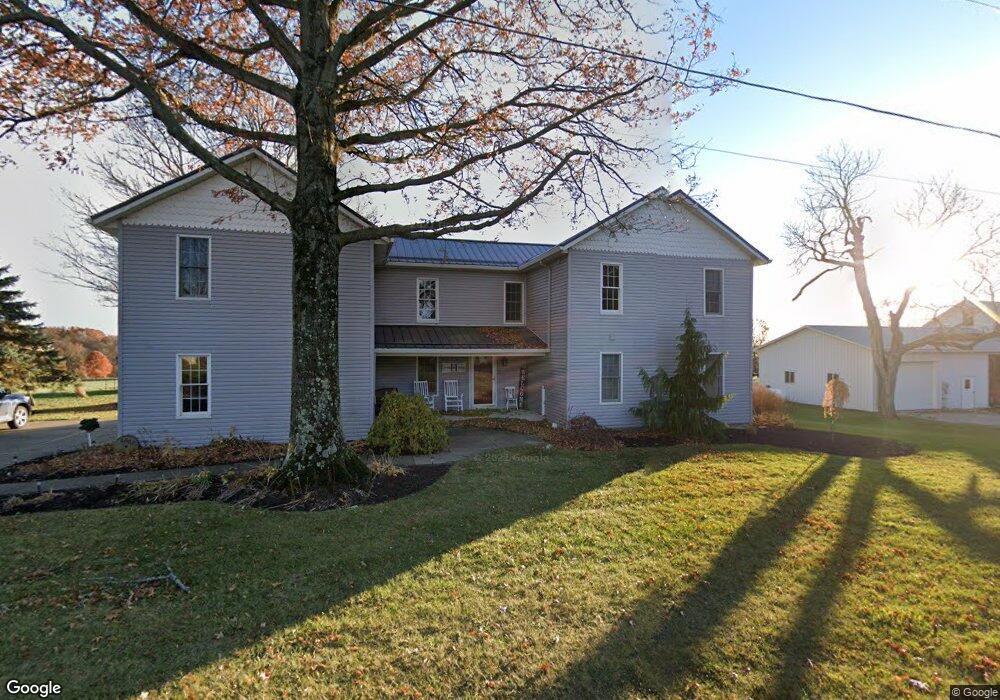
4065 E Messner Rd Wooster, OH 44691
Estimated Value: $235,000 - $432,000
3
Beds
1
Bath
2,384
Sq Ft
$140/Sq Ft
Est. Value
About This Home
This home is located at 4065 E Messner Rd, Wooster, OH 44691 and is currently estimated at $334,849, approximately $140 per square foot. 4065 E Messner Rd is a home located in Wayne County with nearby schools including Triway High School, Spring Hill, and Spring Run.
Ownership History
Date
Name
Owned For
Owner Type
Purchase Details
Closed on
Mar 13, 2017
Sold by
Hostetler Perry B and Hostetler Jennifer
Bought by
Hostetler Perry B and Hostetler Jennifer
Current Estimated Value
Purchase Details
Closed on
Sep 18, 2000
Sold by
Hostetler Perry L
Bought by
Hostetler Perry B and Hostetler Jennifer
Home Financials for this Owner
Home Financials are based on the most recent Mortgage that was taken out on this home.
Original Mortgage
$77,600
Outstanding Balance
$28,363
Interest Rate
8.14%
Mortgage Type
New Conventional
Estimated Equity
$306,486
Purchase Details
Closed on
Dec 29, 1995
Sold by
Daisy L Hostetler Est
Bought by
Hostetler Perry L
Home Financials for this Owner
Home Financials are based on the most recent Mortgage that was taken out on this home.
Original Mortgage
$25,000
Interest Rate
7.42%
Mortgage Type
New Conventional
Create a Home Valuation Report for This Property
The Home Valuation Report is an in-depth analysis detailing your home's value as well as a comparison with similar homes in the area
Purchase History
| Date | Buyer | Sale Price | Title Company |
|---|---|---|---|
| Hostetler Perry B | -- | None Available | |
| Hostetler Perry B | $80,000 | -- | |
| Hostetler Perry L | $45,000 | -- |
Source: Public Records
Mortgage History
| Date | Status | Borrower | Loan Amount |
|---|---|---|---|
| Open | Hostetler Perry B | $77,600 | |
| Previous Owner | Hostetler Perry L | $25,000 |
Source: Public Records
Tax History
| Year | Tax Paid | Tax Assessment Tax Assessment Total Assessment is a certain percentage of the fair market value that is determined by local assessors to be the total taxable value of land and additions on the property. | Land | Improvement |
|---|---|---|---|---|
| 2024 | $3,705 | $106,970 | $56,160 | $50,810 |
| 2023 | $3,733 | $106,970 | $56,160 | $50,810 |
| 2022 | $2,790 | $73,270 | $38,470 | $34,800 |
| 2021 | $2,796 | $73,270 | $38,470 | $34,800 |
| 2020 | $2,830 | $73,270 | $38,470 | $34,800 |
| 2019 | $2,601 | $65,350 | $36,130 | $29,220 |
| 2018 | $2,648 | $65,350 | $36,130 | $29,220 |
| 2017 | $2,168 | $65,350 | $36,130 | $29,220 |
| 2016 | $1,739 | $42,670 | $23,550 | $19,120 |
| 2015 | $1,699 | $42,670 | $23,550 | $19,120 |
| 2014 | $1,701 | $42,670 | $23,550 | $19,120 |
| 2013 | $1,699 | $42,410 | $22,100 | $20,310 |
Source: Public Records
Map
Nearby Homes
- 4348 Buss Rd
- 3419 Fredericksburg Rd
- 3065 Dover Rd
- 115 Cemetery St
- 0 Nonpariel Rd
- 132 Villard St
- 339 Villard St
- 8791 James Rd
- 311 Valley View Dr
- 3299 Crestview Dr
- 4974 E Lincoln Way
- 2717 Timothy Place
- 1045 Pittsburgh Ave
- 140 Ohio St
- 606 E Henry St
- 318 S Grant St
- 1034 Blachleyville Rd
- 10322 Dover Rd
- 2630 Bauman Dr
- 314 Kountz Dr
- 4064 E Messner Rd
- 4010 E Messner Rd
- 4094 E Messner Rd
- 4224 E Messner Rd
- 4050 E Messner Rd
- 4150 E Messner Rd
- 3926 E Messner Rd
- 4204 E Messner Rd
- 4286 E Messner Rd
- 4229 E Messner Rd
- 4181 E Messner Rd
- 3868 E Messner Rd
- 3924 E Messner Rd
- 4001 E Messner Rd
- 4318 E Messner Rd
- 3833 E Messner Rd
- 4356 E Messner Rd
- 4030 E Messner Rd
- 3788 E Messner Rd
- 4331 E Messner Rd
Your Personal Tour Guide
Ask me questions while you tour the home.