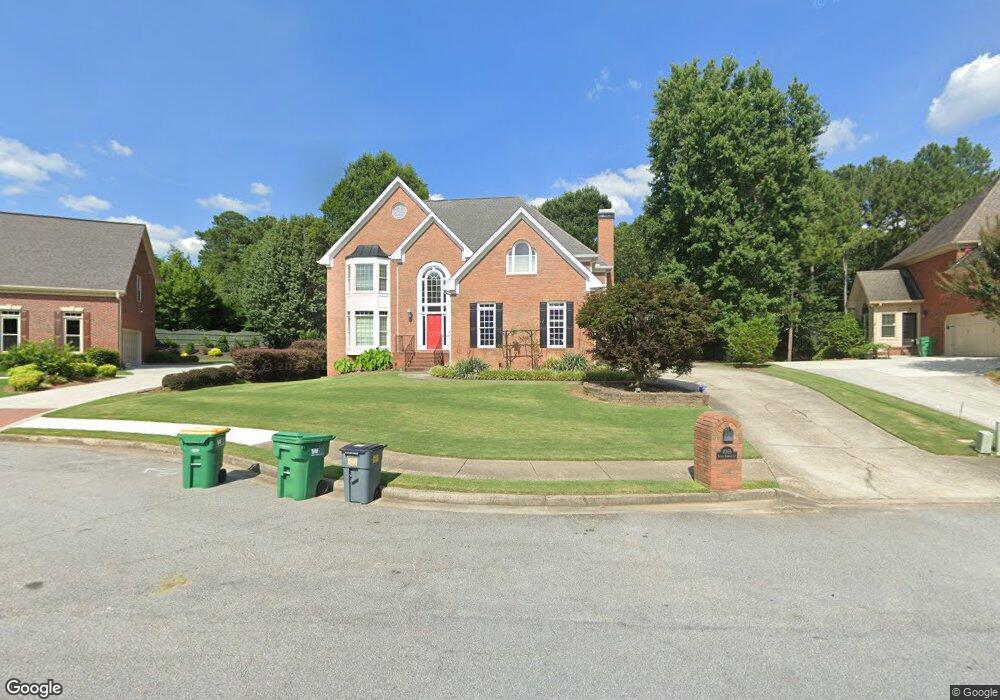
4065 Kings Paddock Ct Unit 1 Norcross, GA 30092
Estimated Value: $795,954 - $997,000
4
Beds
4
Baths
3,130
Sq Ft
$291/Sq Ft
Est. Value
About This Home
This home is located at 4065 Kings Paddock Ct Unit 1, Norcross, GA 30092 and is currently estimated at $911,739, approximately $291 per square foot. 4065 Kings Paddock Ct Unit 1 is a home located in Gwinnett County with nearby schools including Simpson Elementary School, Pinckneyville Middle School, and Norcross High School.
Ownership History
Date
Name
Owned For
Owner Type
Purchase Details
Closed on
May 17, 2004
Sold by
Brown Kenneth E
Bought by
Kula Jeffrey A and Kula Meredith
Current Estimated Value
Home Financials for this Owner
Home Financials are based on the most recent Mortgage that was taken out on this home.
Original Mortgage
$383,600
Outstanding Balance
$72,768
Interest Rate
3%
Mortgage Type
New Conventional
Estimated Equity
$838,971
Purchase Details
Closed on
Mar 28, 1994
Sold by
King Fred L
Bought by
Brown Kenneth E
Home Financials for this Owner
Home Financials are based on the most recent Mortgage that was taken out on this home.
Original Mortgage
$197,400
Interest Rate
7.26%
Create a Home Valuation Report for This Property
The Home Valuation Report is an in-depth analysis detailing your home's value as well as a comparison with similar homes in the area
Home Values in the Area
Average Home Value in this Area
Purchase History
| Date | Buyer | Sale Price | Title Company |
|---|---|---|---|
| Kula Jeffrey A | $479,500 | -- | |
| Brown Kenneth E | $246,900 | -- |
Source: Public Records
Mortgage History
| Date | Status | Borrower | Loan Amount |
|---|---|---|---|
| Open | Kula Jeffrey A | $383,600 | |
| Previous Owner | Brown Kenneth E | $197,400 |
Source: Public Records
Tax History Compared to Growth
Tax History
| Year | Tax Paid | Tax Assessment Tax Assessment Total Assessment is a certain percentage of the fair market value that is determined by local assessors to be the total taxable value of land and additions on the property. | Land | Improvement |
|---|---|---|---|---|
| 2024 | $7,954 | $282,600 | $67,600 | $215,000 |
| 2023 | $7,954 | $283,200 | $67,600 | $215,600 |
| 2022 | $7,325 | $251,360 | $62,000 | $189,360 |
| 2021 | $6,503 | $205,000 | $44,000 | $161,000 |
| 2020 | $6,352 | $205,000 | $44,000 | $161,000 |
| 2019 | $6,352 | $205,000 | $44,000 | $161,000 |
| 2018 | $6,377 | $205,000 | $44,000 | $161,000 |
| 2016 | $5,969 | $187,960 | $40,000 | $147,960 |
| 2015 | $5,754 | $175,320 | $36,000 | $139,320 |
| 2014 | -- | $175,320 | $36,000 | $139,320 |
Source: Public Records
Map
Nearby Homes
- 5201 Edgerton Dr
- 5062 Bridgeport Ln
- 5206 Creek Walk Cir
- 4188 Riverview Dr
- 5067 Audley Ln
- 5018 Wickford Dr
- 0 Medlock Bridge Rd Unit 7311679
- 4916 Sudbrook Way Unit 253
- The Adams Plan at Waterside - Condos
- 4457 Watervale Way Unit 292
- 4477 Watervale Way Unit 286
- 5047 Shirley Oaks Dr Unit 313
- 4903 Sudbrook Way Unit 239
- The Stanley Plan at Waterside - Single Family
- The Stafford Plan at Waterside - Single Family
- 5039 Shirley Oaks Dr Unit 315
- 4479 Watervale Way Unit 285
- 5059 Shirley Oaks Dr Unit 309
- The Barrett II Plan at Waterside - Condos
- The Benton II Plan at Waterside - Townhomes
- 4055 Kings Paddock Ct Unit 1
- 4075 Kings Paddock Ct
- 4045 Kings Paddock Ct Unit 1
- 4085 Kings Paddock Ct
- 4044 Kings Paddock Ct Unit 1
- 5097 Rebel Ridge Ct Unit 1
- 505 Broadgreen Dr
- 5415 Broadgreen Dr
- 4084 Kings Paddock Ct
- 4074 Kings Paddock Ct
- 5096 Broadgreen Dr Unit 1
- 4035 Kings Paddock Ct
- 5098 Rebel Ridge Ct
- 4024 Kings Paddock Ct
- 0 Broadgreen Dr NW Unit 8751075
- 0 Broadgreen Dr NW Unit 8778005
- 0 Broadgreen Dr NW Unit 8881237
- 0 Broadgreen Dr NW Unit 3138029
- 0 Broadgreen Dr NW Unit 7080464
- 0 Broadgreen Dr NW Unit 7109899