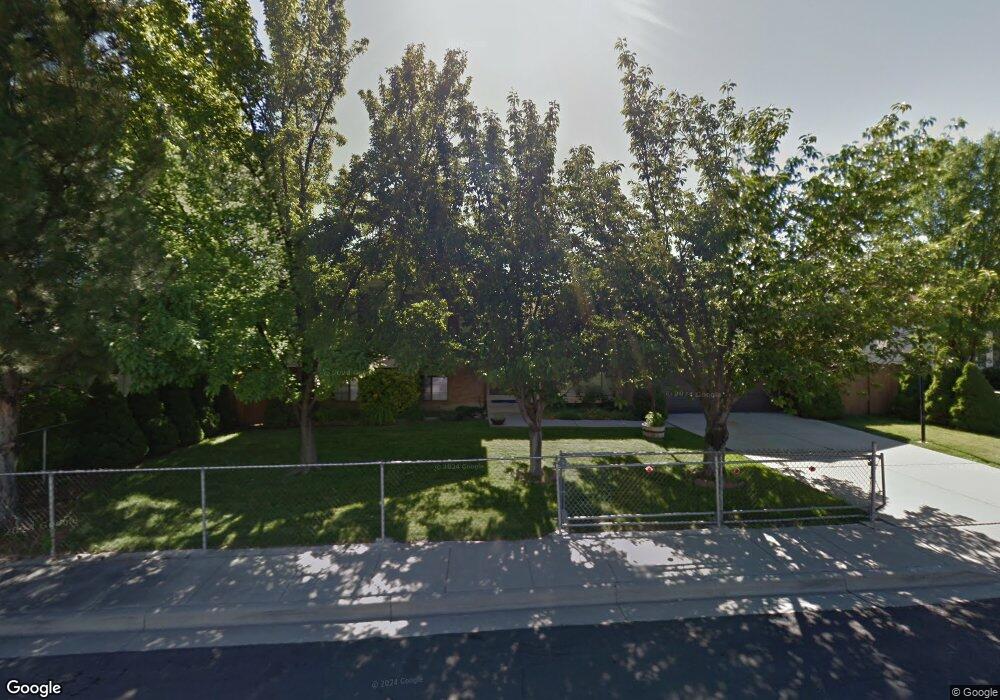
4065 S 4425 W Salt Lake City, UT 84120
Granger NeighborhoodEstimated Value: $474,000 - $500,000
3
Beds
3
Baths
2,206
Sq Ft
$223/Sq Ft
Est. Value
About This Home
This home is located at 4065 S 4425 W, Salt Lake City, UT 84120 and is currently estimated at $492,237, approximately $223 per square foot. 4065 S 4425 W is a home located in Salt Lake County with nearby schools including Jackling Elementary School, Kennedy Junior High School, and Hunter High School.
Ownership History
Date
Name
Owned For
Owner Type
Purchase Details
Closed on
Aug 30, 2017
Sold by
Albercio Frank and Albercio Catherine L
Bought by
Dinh Minh Cong
Current Estimated Value
Home Financials for this Owner
Home Financials are based on the most recent Mortgage that was taken out on this home.
Original Mortgage
$201,000
Outstanding Balance
$168,119
Interest Rate
3.96%
Mortgage Type
New Conventional
Estimated Equity
$324,118
Create a Home Valuation Report for This Property
The Home Valuation Report is an in-depth analysis detailing your home's value as well as a comparison with similar homes in the area
Home Values in the Area
Average Home Value in this Area
Purchase History
| Date | Buyer | Sale Price | Title Company |
|---|---|---|---|
| Dinh Minh Cong | -- | Us Title |
Source: Public Records
Mortgage History
| Date | Status | Borrower | Loan Amount |
|---|---|---|---|
| Open | Dinh Minh Cong | $201,000 |
Source: Public Records
Tax History Compared to Growth
Tax History
| Year | Tax Paid | Tax Assessment Tax Assessment Total Assessment is a certain percentage of the fair market value that is determined by local assessors to be the total taxable value of land and additions on the property. | Land | Improvement |
|---|---|---|---|---|
| 2025 | $3,000 | $463,000 | $133,900 | $329,100 |
| 2024 | $3,000 | $459,600 | $130,300 | $329,300 |
| 2023 | $2,903 | $425,800 | $125,300 | $300,500 |
| 2022 | $2,856 | $420,100 | $122,800 | $297,300 |
| 2021 | $2,518 | $332,800 | $94,500 | $238,300 |
| 2020 | $2,340 | $291,900 | $88,400 | $203,500 |
| 2019 | $2,297 | $276,400 | $83,400 | $193,000 |
| 2018 | $2,202 | $255,300 | $83,400 | $171,900 |
| 2017 | $1,921 | $226,600 | $79,000 | $147,600 |
| 2016 | $1,719 | $203,100 | $79,000 | $124,100 |
| 2015 | $1,601 | $180,100 | $84,000 | $96,100 |
| 2014 | $1,568 | $172,800 | $81,400 | $91,400 |
Source: Public Records
Map
Nearby Homes