Estimated Value: $421,925 - $440,000
3
Beds
2
Baths
1,428
Sq Ft
$300/Sq Ft
Est. Value
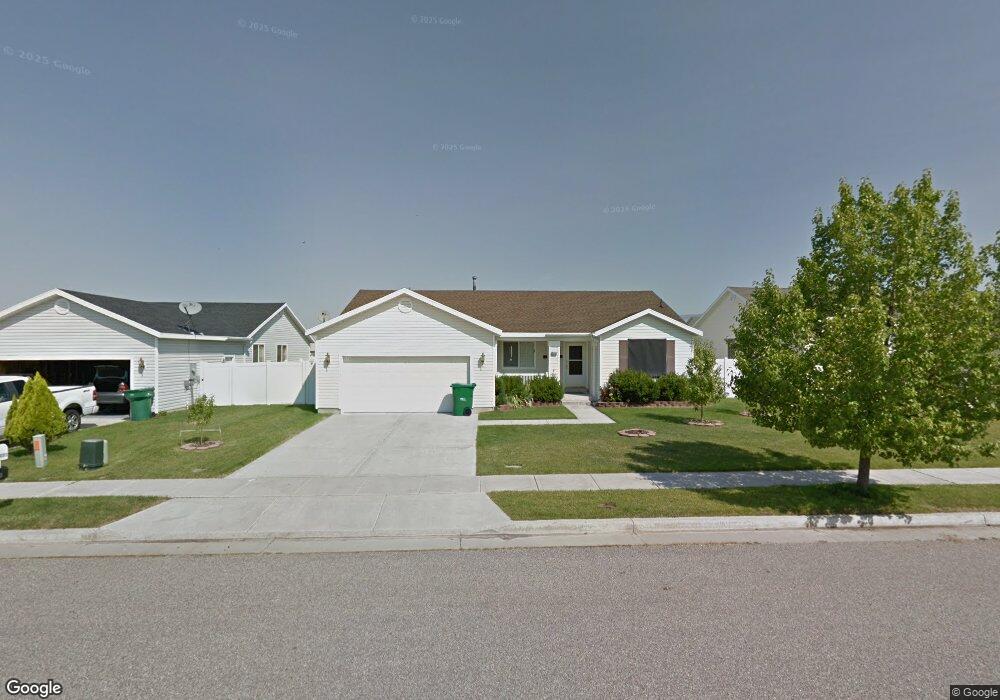
About This Home
This home is located at 4066 W 5050 S, Roy, UT 84067 and is currently estimated at $427,981, approximately $299 per square foot. 4066 W 5050 S is a home located in Weber County with nearby schools including Country View School, Rocky Mountain Junior High School, and Bridge Elementary School.
Ownership History
Date
Name
Owned For
Owner Type
Purchase Details
Closed on
May 21, 2007
Sold by
Fowers Stuart B and Fowers Autumn M
Bought by
Izydorczyk Wieslaw Jozef and Izydorczyk Ewa Jolanta
Current Estimated Value
Purchase Details
Closed on
Feb 27, 2001
Sold by
Cambridge Homes Lc
Bought by
Fowers Stuart B and Fowers Autumn M
Home Financials for this Owner
Home Financials are based on the most recent Mortgage that was taken out on this home.
Original Mortgage
$122,780
Interest Rate
6.98%
Mortgage Type
FHA
Create a Home Valuation Report for This Property
The Home Valuation Report is an in-depth analysis detailing your home's value as well as a comparison with similar homes in the area
Home Values in the Area
Average Home Value in this Area
Purchase History
| Date | Buyer | Sale Price | Title Company |
|---|---|---|---|
| Izydorczyk Wieslaw Jozef | -- | Bonneville Superior Title Co | |
| Fowers Stuart B | -- | Merrill Title |
Source: Public Records
Mortgage History
| Date | Status | Borrower | Loan Amount |
|---|---|---|---|
| Previous Owner | Fowers Stuart B | $122,780 |
Source: Public Records
Tax History
| Year | Tax Paid | Tax Assessment Tax Assessment Total Assessment is a certain percentage of the fair market value that is determined by local assessors to be the total taxable value of land and additions on the property. | Land | Improvement |
|---|---|---|---|---|
| 2025 | $2,601 | $412,047 | $125,007 | $287,040 |
| 2024 | $2,516 | $220,549 | $68,753 | $151,796 |
| 2023 | $2,543 | $224,400 | $65,864 | $158,536 |
| 2022 | $2,611 | $237,600 | $57,758 | $179,842 |
| 2021 | $2,046 | $304,000 | $79,963 | $224,037 |
| 2020 | $1,980 | $271,000 | $79,963 | $191,037 |
| 2019 | $1,883 | $242,000 | $44,976 | $197,024 |
| 2018 | $1,736 | $209,000 | $42,041 | $166,959 |
| 2017 | $1,643 | $185,000 | $42,041 | $142,959 |
| 2016 | $1,582 | $95,713 | $21,944 | $73,769 |
| 2015 | $1,414 | $86,930 | $21,944 | $64,986 |
| 2014 | $1,375 | $83,389 | $19,237 | $64,152 |
Source: Public Records
Map
Nearby Homes
- 4088 W 5050 S
- 4096 W 5075 S
- 4218 W 5050 S
- 4216 W 5250 S
- 5035 S 4275 W
- 4950 3900 West St
- 4277 W 5250 S
- 4853 S 4275 W Unit 27
- 4813 S 3850 W
- 4239 W 5325 S
- 4024 W 4650 S
- 4101 W 4600 S
- 5444 S 4050 W
- 4602 S 4000 W
- 3517 W 4835 S Unit 27
- 3509 W 4835 S Unit 26
- 4486 S 4300 W
- 3832 W 5625 S
- 3443 W 5200 S Unit 2&3
- 4931 S 4700 W
Your Personal Tour Guide
Ask me questions while you tour the home.