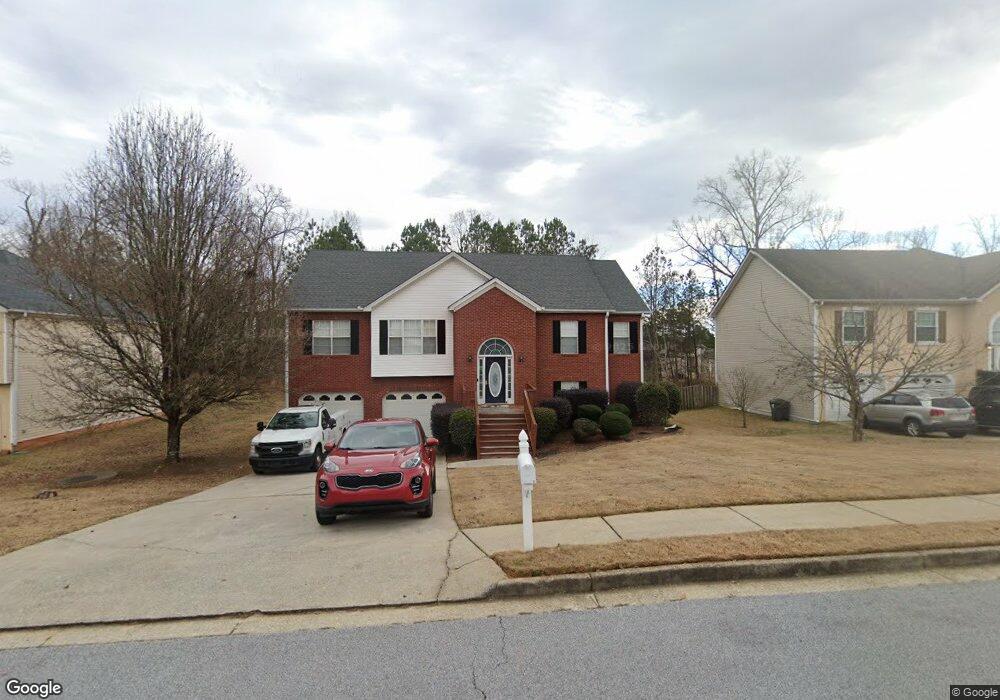
4067 Big Rub Trail Douglasville, GA 30135
Anneewakee NeighborhoodEstimated Value: $318,000 - $365,000
3
Beds
2
Baths
1,771
Sq Ft
$190/Sq Ft
Est. Value
About This Home
This home is located at 4067 Big Rub Trail, Douglasville, GA 30135 and is currently estimated at $335,622, approximately $189 per square foot. 4067 Big Rub Trail is a home located in Douglas County with nearby schools including Holly Springs Elementary School, Chapel Hill Middle School, and Chapel Hill High School.
Ownership History
Date
Name
Owned For
Owner Type
Purchase Details
Closed on
Feb 11, 2022
Sold by
Tamara Clemons
Bought by
Chevannes Natori
Current Estimated Value
Home Financials for this Owner
Home Financials are based on the most recent Mortgage that was taken out on this home.
Original Mortgage
$203,500
Outstanding Balance
$188,988
Interest Rate
3.56%
Mortgage Type
FHA
Estimated Equity
$146,634
Purchase Details
Closed on
Oct 10, 2001
Sold by
Apex Homes Inc
Bought by
Clemons David C and Clemons Tamara
Home Financials for this Owner
Home Financials are based on the most recent Mortgage that was taken out on this home.
Original Mortgage
$160,500
Interest Rate
6.99%
Mortgage Type
FHA
Purchase Details
Closed on
Jun 28, 2001
Sold by
Exxell Developers Inc
Bought by
Apex Homes Inc
Home Financials for this Owner
Home Financials are based on the most recent Mortgage that was taken out on this home.
Original Mortgage
$109,539
Interest Rate
6.72%
Mortgage Type
New Conventional
Create a Home Valuation Report for This Property
The Home Valuation Report is an in-depth analysis detailing your home's value as well as a comparison with similar homes in the area
Home Values in the Area
Average Home Value in this Area
Purchase History
| Date | Buyer | Sale Price | Title Company |
|---|---|---|---|
| Chevannes Natori | $275,000 | New Title Company Name | |
| Clemons David C | $163,100 | -- | |
| Apex Homes Inc | $30,800 | -- |
Source: Public Records
Mortgage History
| Date | Status | Borrower | Loan Amount |
|---|---|---|---|
| Open | Chevannes Natori | $203,500 | |
| Previous Owner | Clemons David C | $160,500 | |
| Previous Owner | Apex Homes Inc | $109,539 |
Source: Public Records
Tax History Compared to Growth
Tax History
| Year | Tax Paid | Tax Assessment Tax Assessment Total Assessment is a certain percentage of the fair market value that is determined by local assessors to be the total taxable value of land and additions on the property. | Land | Improvement |
|---|---|---|---|---|
| 2024 | $3,815 | $134,440 | $26,400 | $108,040 |
| 2023 | $3,815 | $134,440 | $26,400 | $108,040 |
| 2022 | $2,896 | $103,760 | $22,000 | $81,760 |
| 2021 | $2,509 | $84,200 | $18,160 | $66,040 |
| 2020 | $2,446 | $79,360 | $13,320 | $66,040 |
| 2019 | $2,257 | $76,840 | $13,320 | $63,520 |
| 2018 | $2,152 | $71,240 | $12,640 | $58,600 |
| 2017 | $2,052 | $66,200 | $13,040 | $53,160 |
| 2016 | $1,956 | $62,200 | $12,800 | $49,400 |
| 2015 | $1,918 | $59,840 | $12,920 | $46,920 |
| 2014 | $1,638 | $50,440 | $11,880 | $38,560 |
| 2013 | -- | $53,600 | $12,240 | $41,360 |
Source: Public Records
Map
Nearby Homes
- 4232 Antler Ct
- 4112 Twig Ct
- 4159 Birch Bark Way
- 4299 High Country Dr
- 4015 Soaring Dr
- 4039 Chapel Hill Rd
- 4066 Wedgefield Ct
- 3939 Craggy Perch
- 3863 Grist Mill
- 4050 Harvest Ridge Dr
- 0 E Chapel Hill Rd
- 3945 Crowned Eagle
- 4401 Hampton Mill Pkwy
- 3771 Tackett Rd Unit 1
- 4020 Willow Ridge Rd
- 3784 Tackett Rd
- 4345 Foxfire Ct
- 4335 Foxfire Ct
- 4063 Big Rub Trail Unit 5
- 4071 Big Rub Trail
- 0 Big Rub Tr
- 4059 Big Rub Trail
- 4075 Big Rub Trail
- 4059 Big Rub Tr
- 4064 High Country Dr
- 4068 High Country Dr
- 4060 High Country Dr
- 4072 High Country Dr Unit 5
- 4066 Big Rub Trail
- 4055 Big Rub Trail
- 4079 Big Rub Trail
- 4070 Big Rub Trail
- 4060 Big Rub Trail
- 4076 High Country Dr Unit 5
- 4074 Big Rub Trail
- 4056 Big Rub Trail
- 4056 High Country Dr
- 4051 Big Rub Trail Unit 5