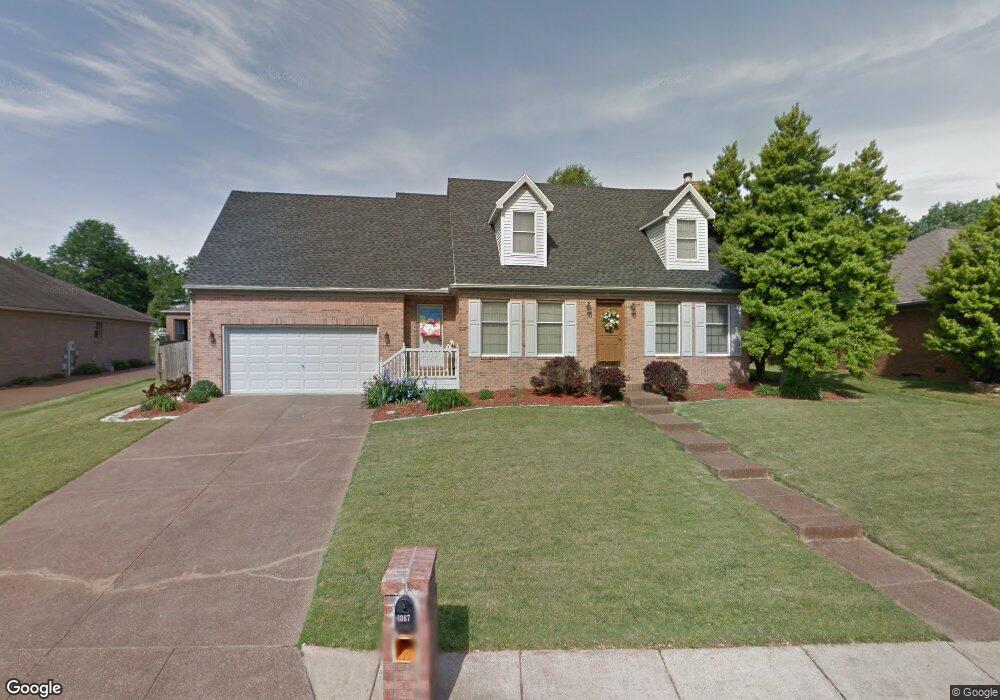
4067 Evergreen Ct Newburgh, IN 47630
Estimated Value: $316,087 - $385,000
4
Beds
2
Baths
2,427
Sq Ft
$147/Sq Ft
Est. Value
About This Home
This home is located at 4067 Evergreen Ct, Newburgh, IN 47630 and is currently estimated at $357,522, approximately $147 per square foot. 4067 Evergreen Ct is a home located in Warrick County with nearby schools including John H. Castle Elementary School, Castle North Middle School, and Castle High School.
Ownership History
Date
Name
Owned For
Owner Type
Purchase Details
Closed on
Mar 20, 2006
Sold by
Carl Donnie L
Bought by
Carl Mary B
Current Estimated Value
Home Financials for this Owner
Home Financials are based on the most recent Mortgage that was taken out on this home.
Original Mortgage
$136,000
Outstanding Balance
$75,387
Interest Rate
6.33%
Mortgage Type
New Conventional
Estimated Equity
$282,135
Create a Home Valuation Report for This Property
The Home Valuation Report is an in-depth analysis detailing your home's value as well as a comparison with similar homes in the area
Home Values in the Area
Average Home Value in this Area
Purchase History
| Date | Buyer | Sale Price | Title Company |
|---|---|---|---|
| Carl Mary B | -- | None Available |
Source: Public Records
Mortgage History
| Date | Status | Borrower | Loan Amount |
|---|---|---|---|
| Open | Carl Mary B | $136,000 |
Source: Public Records
Tax History
| Year | Tax Paid | Tax Assessment Tax Assessment Total Assessment is a certain percentage of the fair market value that is determined by local assessors to be the total taxable value of land and additions on the property. | Land | Improvement |
|---|---|---|---|---|
| 2025 | $1,751 | $263,100 | $21,000 | $242,100 |
| 2024 | $1,751 | $240,400 | $22,400 | $218,000 |
| 2023 | $1,681 | $235,700 | $27,800 | $207,900 |
| 2022 | $1,577 | $215,400 | $27,800 | $187,600 |
| 2021 | $1,431 | $188,600 | $30,200 | $158,400 |
| 2020 | $1,377 | $174,600 | $28,200 | $146,400 |
| 2019 | $1,360 | $168,100 | $28,200 | $139,900 |
| 2018 | $1,177 | $157,700 | $28,200 | $129,500 |
| 2017 | $1,119 | $152,700 | $28,200 | $124,500 |
| 2016 | $1,045 | $146,100 | $28,200 | $117,900 |
| 2014 | $986 | $148,600 | $26,200 | $122,400 |
| 2013 | $889 | $140,900 | $26,200 | $114,700 |
Source: Public Records
Map
Nearby Homes
- 4318 Huntington Ridge Cir
- 4200 Hare Ct
- 4500 Clint Cir
- 8911 Blackstone Dr
- 4433 Stonegarden Ln
- 4350 Wynbrooke Ct
- 3895 High Pointe Dr
- 3879 High Pointe Dr
- 4422 Wynbrooke Dr
- 4266 Foxmoor Dr
- 9904 Arbor Lake Dr
- 8855 Hickory Ln
- 3611 Sand Dr
- 8511 Pebble Creek Dr
- 8523 Pebble Creek Dr
- 3536 Montgomery Ct
- 3581 Sand Dr
- 3529 Montgomery Ct
- 3569 Sand Dr
- 3527 Sand Dr
- 4077 Evergreen Ct
- 4055 Evergreen Ct
- 4068 Evergreen Ct
- 4078 Evergreen Ct
- 4033 Evergreen Ct
- 4066 Evergreen Ct
- 9288 Brittany Dr
- 4080 Evergreen Ct
- 9300 Brittany Dr
- 4044 Evergreen Ct
- 4023 Evergreen Ct
- 9255 W State Route 66
- 9244 Brittany Dr
- 4000 Evergreen Ct
- 4100 Forest Green Dr
- 4022 Evergreen Ct
- 9222 Brittany Dr
- 4111 Forest Green Dr
- 4111 Roseview Ct
- 9233 W State Route 66
Your Personal Tour Guide
Ask me questions while you tour the home.