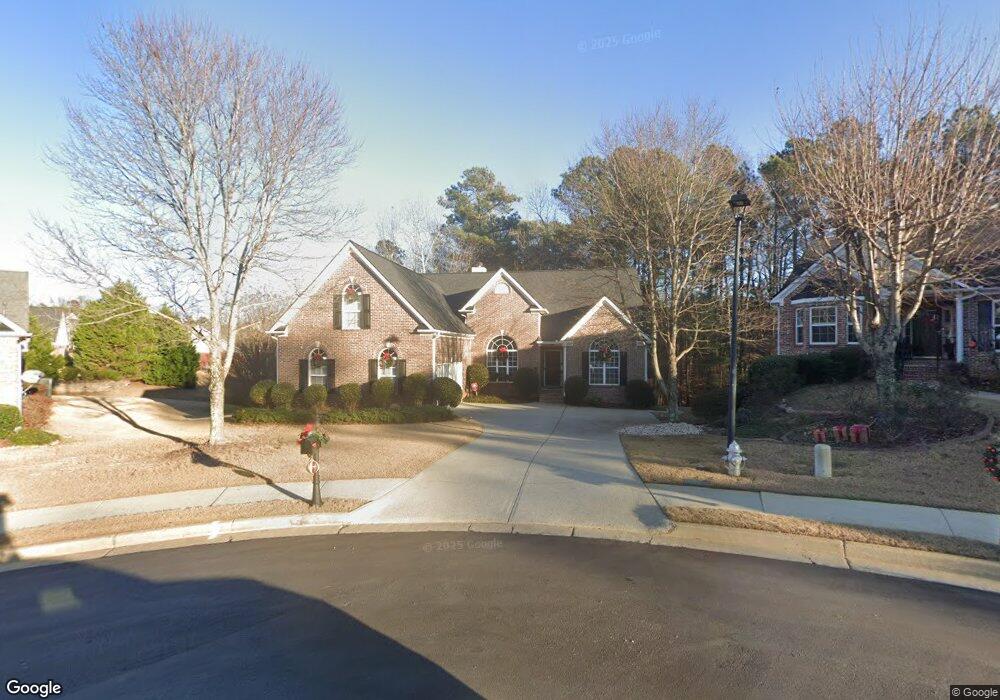
4067 Roslindale Ln Buford, GA 30519
Estimated Value: $457,106 - $562,000
4
Beds
2
Baths
2,536
Sq Ft
$197/Sq Ft
Est. Value
About This Home
This home is located at 4067 Roslindale Ln, Buford, GA 30519 and is currently estimated at $499,027, approximately $196 per square foot. 4067 Roslindale Ln is a home located in Gwinnett County with nearby schools including Harmony Elementary School and Glenn C. Jones Middle School.
Ownership History
Date
Name
Owned For
Owner Type
Purchase Details
Closed on
Aug 2, 2007
Sold by
Ernest Victor D and Ernest Gloria L
Bought by
Luttenberg Edward W and Luttenberg Carol F
Current Estimated Value
Home Financials for this Owner
Home Financials are based on the most recent Mortgage that was taken out on this home.
Original Mortgage
$101,000
Outstanding Balance
$63,260
Interest Rate
6.63%
Mortgage Type
New Conventional
Estimated Equity
$435,767
Purchase Details
Closed on
Mar 15, 2004
Sold by
Stoneleigh Builders Inc
Bought by
Ernest Victor D and Ernest Gloria
Home Financials for this Owner
Home Financials are based on the most recent Mortgage that was taken out on this home.
Original Mortgage
$200,100
Interest Rate
5.53%
Mortgage Type
New Conventional
Purchase Details
Closed on
Oct 21, 2003
Sold by
Sandy Hill Dev Inc
Bought by
Stoneleigh Builders Inc
Create a Home Valuation Report for This Property
The Home Valuation Report is an in-depth analysis detailing your home's value as well as a comparison with similar homes in the area
Home Values in the Area
Average Home Value in this Area
Purchase History
| Date | Buyer | Sale Price | Title Company |
|---|---|---|---|
| Luttenberg Edward W | $310,000 | -- | |
| Ernest Victor D | $250,200 | -- | |
| Stoneleigh Builders Inc | $48,500 | -- |
Source: Public Records
Mortgage History
| Date | Status | Borrower | Loan Amount |
|---|---|---|---|
| Open | Luttenberg Edward W | $101,000 | |
| Previous Owner | Ernest Victor D | $200,100 |
Source: Public Records
Tax History Compared to Growth
Tax History
| Year | Tax Paid | Tax Assessment Tax Assessment Total Assessment is a certain percentage of the fair market value that is determined by local assessors to be the total taxable value of land and additions on the property. | Land | Improvement |
|---|---|---|---|---|
| 2025 | $1,448 | $222,000 | $40,000 | $182,000 |
| 2024 | $1,442 | $159,760 | $34,000 | $125,760 |
| 2023 | $1,442 | $159,760 | $34,000 | $125,760 |
| 2022 | $1,403 | $150,680 | $30,800 | $119,880 |
| 2021 | $1,392 | $123,320 | $22,800 | $100,520 |
| 2020 | $1,390 | $123,320 | $22,800 | $100,520 |
| 2019 | $1,284 | $123,320 | $22,800 | $100,520 |
| 2018 | $1,266 | $112,560 | $19,600 | $92,960 |
| 2016 | $1,302 | $92,120 | $14,800 | $77,320 |
| 2015 | $1,331 | $92,120 | $14,800 | $77,320 |
| 2014 | -- | $92,120 | $14,800 | $77,320 |
Source: Public Records
Map
Nearby Homes
- 3345 Stoneleigh Run Dr
- 3236 Copper Creek Ln NE
- 3939 Bessemer Dr Unit 2
- 3032 Seneca Farm Ln
- 3170 Tallulah Dr
- 3555 Rivers End Place Unit I
- 3606 Andover Way
- 3075 Andover Trail
- 3421 Andover Way
- Sumner Plan at Oakmead
- Essex Plan at Oakmead
- Ingram Plan at Oakmead
- Trenton Plan at Oakmead
- 3311 Burkston Place
- 4034 Dantry Ln
- 4024 Dantry Ln
- 3542 Burkston Place
- 3340 Ivey Ridge Rd
- 3391 Burkston Place
- 4014 Dantry Ln
- 4077 Roslindale Ln
- 4057 Roslindale Ln
- 4080 Archcreek Way
- 4097 Roslindale Ln
- 4064 Roslindale Ln
- 4073 Archcreek Way
- 4117 Roslindale Ln
- 4074 Roslindale Ln
- 4084 Roslindale Ln
- 4090 Archcreek Way
- 4083 Archcreek Way
- 4127 Roslindale Ln
- 4094 Roslindale Ln
- 3605 Stoneleigh Run Dr
- 3595 Stoneleigh Run Dr
- 4093 Archcreek Way
- 4104 Roslindale Ln Unit 4104
- 4104 Roslindale Ln
- 4104 Roslindale Ln
- 3585 Stoneleigh Run Dr