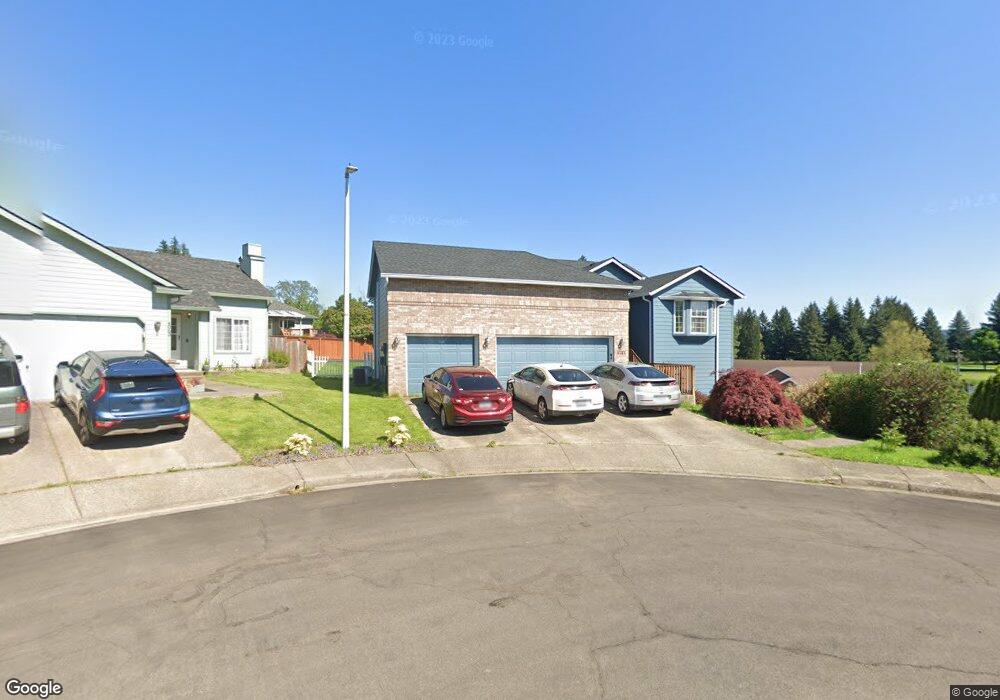
4068 K Ct Washougal, WA 98671
Estimated Value: $521,000 - $674,000
5
Beds
8
Baths
1,666
Sq Ft
$364/Sq Ft
Est. Value
About This Home
This home is located at 4068 K Ct, Washougal, WA 98671 and is currently estimated at $605,601, approximately $363 per square foot. 4068 K Ct is a home located in Clark County with nearby schools including Columbia River Gorge Elementary School, Jemtegaard Middle School, and Washougal High School.
Ownership History
Date
Name
Owned For
Owner Type
Purchase Details
Closed on
Oct 25, 2022
Sold by
Sams Jon R and Sams Sandra K
Bought by
Jon R Sams And Sandra K Sams Revocable Living
Current Estimated Value
Purchase Details
Closed on
Aug 11, 1999
Sold by
Kimball Hill Homes Washington Inc
Bought by
Sams Jon R and Sams Sandra K
Home Financials for this Owner
Home Financials are based on the most recent Mortgage that was taken out on this home.
Original Mortgage
$226,885
Interest Rate
7.7%
Create a Home Valuation Report for This Property
The Home Valuation Report is an in-depth analysis detailing your home's value as well as a comparison with similar homes in the area
Home Values in the Area
Average Home Value in this Area
Purchase History
| Date | Buyer | Sale Price | Title Company |
|---|---|---|---|
| Jon R Sams And Sandra K Sams Revocable Living | -- | -- | |
| Sams Jon R | $252,099 | Chicago Title Insurance Co |
Source: Public Records
Mortgage History
| Date | Status | Borrower | Loan Amount |
|---|---|---|---|
| Previous Owner | Sams Jon R | $226,885 |
Source: Public Records
Tax History Compared to Growth
Tax History
| Year | Tax Paid | Tax Assessment Tax Assessment Total Assessment is a certain percentage of the fair market value that is determined by local assessors to be the total taxable value of land and additions on the property. | Land | Improvement |
|---|---|---|---|---|
| 2025 | $5,395 | $565,443 | $120,000 | $445,443 |
| 2024 | $5,263 | $568,780 | $144,000 | $424,780 |
| 2023 | $5,164 | $580,768 | $154,800 | $425,968 |
| 2022 | $5,176 | $558,035 | $154,800 | $403,235 |
| 2021 | $5,001 | $485,360 | $132,000 | $353,360 |
| 2020 | $4,830 | $439,939 | $120,000 | $319,939 |
| 2019 | $4,302 | $431,648 | $120,000 | $311,648 |
| 2018 | $4,640 | $406,446 | $0 | $0 |
| 2017 | $3,972 | $361,904 | $0 | $0 |
| 2016 | $3,866 | $340,231 | $0 | $0 |
| 2015 | $3,683 | $302,793 | $0 | $0 |
| 2014 | -- | $286,995 | $0 | $0 |
| 2013 | -- | $248,586 | $0 | $0 |
Source: Public Records
Map
Nearby Homes