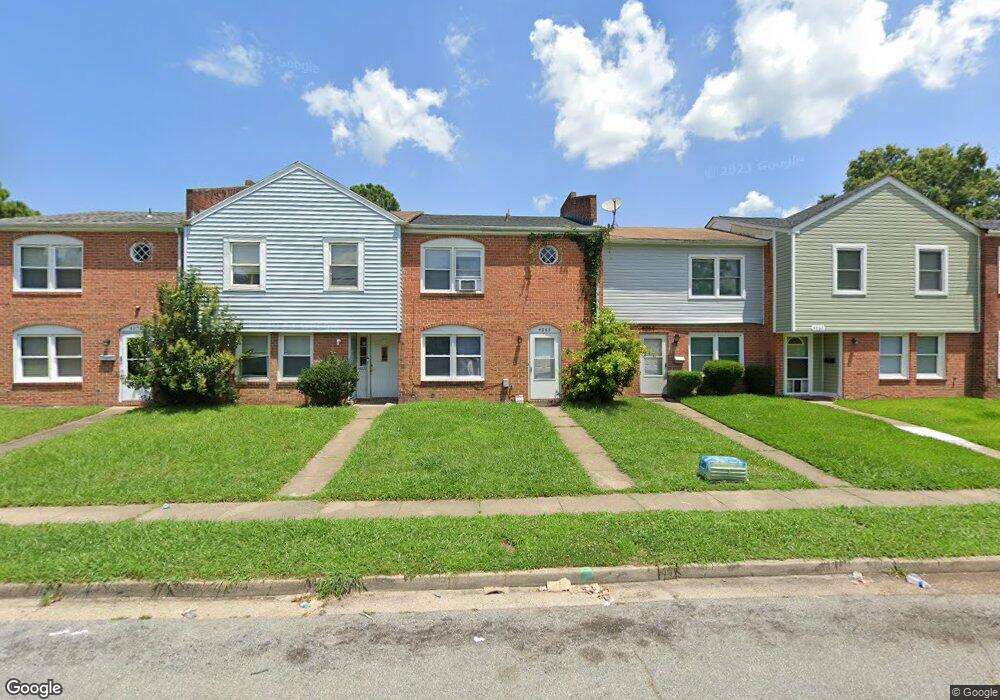
4068 Sloop Trail Chesapeake, VA 23321
Western Branch NeighborhoodEstimated Value: $148,000 - $178,000
3
Beds
2
Baths
1,310
Sq Ft
$124/Sq Ft
Est. Value
About This Home
This home is located at 4068 Sloop Trail, Chesapeake, VA 23321 and is currently estimated at $162,598, approximately $124 per square foot. 4068 Sloop Trail is a home located in Chesapeake City with nearby schools including Southwestern Elementary School, Jolliff Middle School, and Western Branch High School.
Ownership History
Date
Name
Owned For
Owner Type
Purchase Details
Closed on
Mar 12, 2024
Sold by
Donlon Michael J and Caminske Janet T
Bought by
England Ashlyn Peyton
Current Estimated Value
Home Financials for this Owner
Home Financials are based on the most recent Mortgage that was taken out on this home.
Original Mortgage
$159,556
Outstanding Balance
$156,037
Interest Rate
6.25%
Mortgage Type
FHA
Estimated Equity
$6,561
Purchase Details
Closed on
Jun 6, 2022
Sold by
Kmir Llc
Bought by
Donlon Michael J and Caminske Janet T
Home Financials for this Owner
Home Financials are based on the most recent Mortgage that was taken out on this home.
Original Mortgage
$107,100
Interest Rate
4.38%
Mortgage Type
New Conventional
Purchase Details
Closed on
Apr 13, 2022
Sold by
Young-Lewis Corprew Betinna
Bought by
Kmir Llc
Home Financials for this Owner
Home Financials are based on the most recent Mortgage that was taken out on this home.
Original Mortgage
$107,100
Interest Rate
4.38%
Mortgage Type
New Conventional
Purchase Details
Closed on
Apr 18, 2008
Sold by
Bee Kay Enterprizes
Bought by
Young Lewis Corprew Betinna
Home Financials for this Owner
Home Financials are based on the most recent Mortgage that was taken out on this home.
Original Mortgage
$103,377
Interest Rate
6.22%
Mortgage Type
FHA
Create a Home Valuation Report for This Property
The Home Valuation Report is an in-depth analysis detailing your home's value as well as a comparison with similar homes in the area
Home Values in the Area
Average Home Value in this Area
Purchase History
| Date | Buyer | Sale Price | Title Company |
|---|---|---|---|
| England Ashlyn Peyton | $162,500 | Fidelity National Title | |
| Donlon Michael J | $154,900 | Fidelity National Title | |
| Kmir Llc | $102,500 | Fidelity National Title | |
| Young Lewis Corprew Betinna | $105,000 | -- |
Source: Public Records
Mortgage History
| Date | Status | Borrower | Loan Amount |
|---|---|---|---|
| Open | England Ashlyn Peyton | $159,556 | |
| Previous Owner | Donlon Michael J | $107,100 | |
| Previous Owner | Young Lewis Corprew Betinna | $103,377 |
Source: Public Records
Tax History
| Year | Tax Paid | Tax Assessment Tax Assessment Total Assessment is a certain percentage of the fair market value that is determined by local assessors to be the total taxable value of land and additions on the property. | Land | Improvement |
|---|---|---|---|---|
| 2025 | $1,384 | $154,600 | $45,000 | $109,600 |
| 2024 | $1,384 | $137,000 | $40,000 | $97,000 |
| 2023 | $1,134 | $112,300 | $30,000 | $82,300 |
| 2022 | $897 | $88,800 | $20,000 | $68,800 |
| 2021 | $751 | $71,500 | $20,000 | $51,500 |
| 2020 | $735 | $70,000 | $20,000 | $50,000 |
| 2019 | $688 | $65,500 | $20,000 | $45,500 |
| 2018 | $675 | $72,300 | $25,000 | $47,300 |
| 2017 | $734 | $69,900 | $25,000 | $44,900 |
| 2016 | $734 | $69,900 | $25,000 | $44,900 |
| 2015 | $759 | $72,300 | $25,000 | $47,300 |
| 2014 | $759 | $72,300 | $25,000 | $47,300 |
Source: Public Records
Map
Nearby Homes
- 4008 Sloop Trail
- 3860 Schooner Trail
- 4122 Riverside Dr
- 3931 Port Rd
- 3924 Port Rd
- 3980 Port Rd
- 4304 Center Mast Crest
- 3861 Ahoy Dr
- .2ac Airline Blvd
- 4004 River Breeze Cir
- 3932 Pierce Ln
- 4126 River Breeze Cir
- 3917 Rex Cir
- 3709 Bosun Dr
- 3932 Colony Pointe Dr
- 4015 Garwood Ave
- 1432 Pine Grove Ln
- 1908 Rosemary Ln
- 800 Arnold Palmer Dr
- 102 Ben Hogan Dr
- 4072 Sloop Trail
- 4064 Sloop Trail
- 4076 Sloop Trail
- 4060 Sloop Trail
- 4080 Sloop Trail
- 4056 Sloop Trail
- 4084 Sloop Trail
- 4052 Sloop Trail
- 4061 Holly Cove Dr
- 4057 Holly Cove Dr
- 4069 Holly Cove Dr
- 4065 Holly Cove Dr
- 4053 Holly Cove Dr
- 4048 Sloop Trail
- 4049 Holly Cove Dr
- 4073 Holly Cove Dr
- 4045 Holly Cove Dr
- 4060 Schooner Trail
- 4056 Schooner Trail
- 4041 Sloop Trail
Your Personal Tour Guide
Ask me questions while you tour the home.