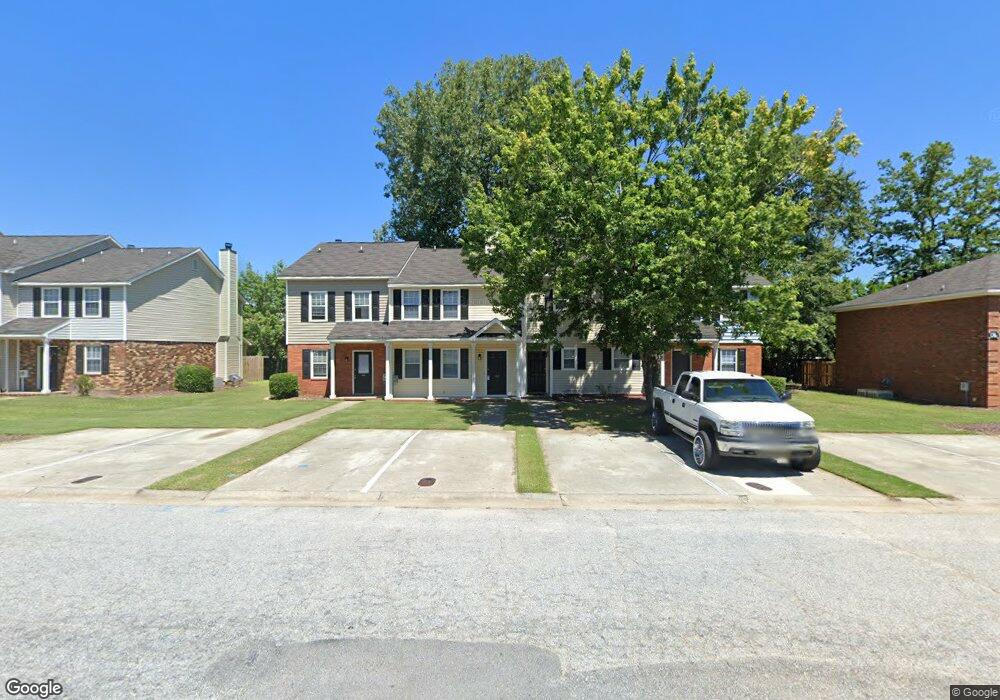
4069 Old Petersburg Rd Augusta, GA 30907
Estimated Value: $208,000 - $214,266
3
Beds
2
Baths
1,417
Sq Ft
$150/Sq Ft
Est. Value
About This Home
This home is located at 4069 Old Petersburg Rd, Augusta, GA 30907 and is currently estimated at $212,067, approximately $149 per square foot. 4069 Old Petersburg Rd is a home located in Columbia County with nearby schools including Northmore Elementary School, Lincoln Elementary School, and South Columbia Elementary School.
Ownership History
Date
Name
Owned For
Owner Type
Purchase Details
Closed on
Apr 30, 2019
Sold by
Syed Ashraf A
Bought by
Ramsay Anthony L
Current Estimated Value
Home Financials for this Owner
Home Financials are based on the most recent Mortgage that was taken out on this home.
Original Mortgage
$139,900
Outstanding Balance
$122,239
Interest Rate
4%
Estimated Equity
$89,828
Purchase Details
Closed on
Jan 19, 2018
Sold by
Syed Hasan M
Bought by
Syed Ashraf A
Purchase Details
Closed on
Jul 5, 2017
Sold by
Underwood Daniel T
Bought by
Syed Ashraf A and Syed Hasan M
Purchase Details
Closed on
Jun 10, 2010
Sold by
Tankersley Leonard
Bought by
Underwood Daniel T
Home Financials for this Owner
Home Financials are based on the most recent Mortgage that was taken out on this home.
Original Mortgage
$118,306
Interest Rate
4.87%
Mortgage Type
FHA
Create a Home Valuation Report for This Property
The Home Valuation Report is an in-depth analysis detailing your home's value as well as a comparison with similar homes in the area
Home Values in the Area
Average Home Value in this Area
Purchase History
| Date | Buyer | Sale Price | Title Company |
|---|---|---|---|
| Ramsay Anthony L | $139,900 | -- | |
| Syed Ashraf A | -- | -- | |
| Syed Ashraf A | $64,500 | -- | |
| Underwood Daniel T | $119,900 | -- |
Source: Public Records
Mortgage History
| Date | Status | Borrower | Loan Amount |
|---|---|---|---|
| Open | Ramsay Anthony L | $139,900 | |
| Previous Owner | Underwood Daniel T | $118,306 |
Source: Public Records
Tax History Compared to Growth
Tax History
| Year | Tax Paid | Tax Assessment Tax Assessment Total Assessment is a certain percentage of the fair market value that is determined by local assessors to be the total taxable value of land and additions on the property. | Land | Improvement |
|---|---|---|---|---|
| 2025 | $1,567 | $63,213 | $17,504 | $45,709 |
| 2024 | $1,590 | $61,278 | $17,504 | $43,774 |
| 2023 | $1,590 | $59,836 | $15,104 | $44,732 |
| 2022 | $1,502 | $55,520 | $14,004 | $41,516 |
| 2021 | $1,468 | $51,828 | $13,304 | $38,524 |
| 2020 | $1,437 | $49,621 | $13,304 | $36,317 |
| 2019 | $1,285 | $44,133 | $10,504 | $33,629 |
| 2018 | $778 | $25,800 | $10,504 | $15,296 |
| 2017 | $1,257 | $42,862 | $9,404 | $33,458 |
| 2016 | $1,195 | $42,146 | $9,180 | $32,966 |
| 2015 | $1,181 | $41,556 | $9,480 | $32,076 |
| 2014 | $1,168 | $40,560 | $9,480 | $31,080 |
Source: Public Records
Map
Nearby Homes
- 4070 Riverwatch Pkwy
- 4069 Riverwatch Pkwy
- 0 Mc Cormick Rd
- 352 Mears St
- 155 Canton Park Ave
- 368 Sumac Trail
- 358 Sumac Trail
- 333 Sumac Trail
- 418 Santa Anna Trail
- 317 Connor Cir
- 5537 Connor Dr
- 323 Connor Cir
- 4157 Arlington Rd
- 386 Connor Cir
- 5553 Connor Dr
- 530 Adams Mill Ln
- 332 Mears St
- 3779 Winchester Trail
- 4106 Mansfield Place
- 233 Anneswood Rd
- 4067 Old Petersburg Rd
- 451 Windtree Place
- 4088 Old Petersburg Rd
- 4086 Old Petersburg Rd
- 453 Windtree Place
- 457 Windtree Place
- 457 Windtree Place
- 450 Windtree Place
- 459 Windtree Place
- 4084 River Watch Pkwy
- 461 Windtree Place
- 4084 Old Petersburg Rd
- 452 Windtree Place
- 463 Windtree Place
- 444 Old Evans Rd
- 454 Windtree Place
- 442 Old Evans Rd
- 402 Windtree Ct
- 370 Candlestick Way
- 456 Windtree Place