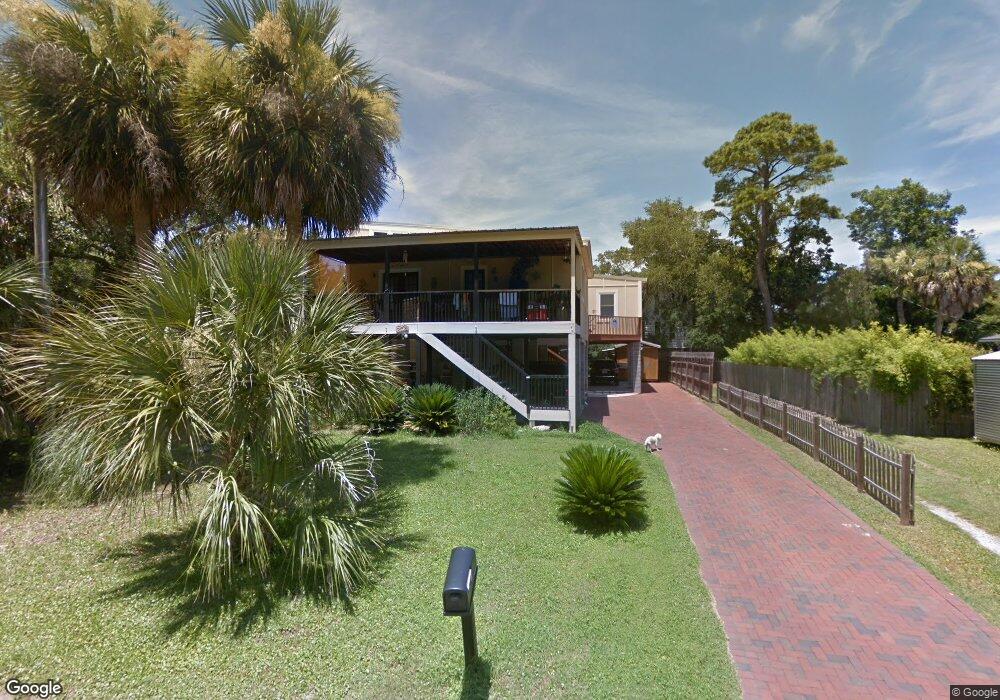
406A 8th St Tybee Island, GA 31328
Estimated Value: $457,000 - $635,000
2
Beds
1
Bath
810
Sq Ft
$664/Sq Ft
Est. Value
About This Home
This home is located at 406A 8th St, Tybee Island, GA 31328 and is currently estimated at $537,868, approximately $664 per square foot. 406A 8th St is a home located in Chatham County with nearby schools including Howard Elementary School, Coastal Middle School, and Islands High School.
Ownership History
Date
Name
Owned For
Owner Type
Purchase Details
Closed on
Dec 8, 2014
Sold by
Fitzhugh Jennifer
Bought by
Manning Richard S
Current Estimated Value
Home Financials for this Owner
Home Financials are based on the most recent Mortgage that was taken out on this home.
Original Mortgage
$240,000
Outstanding Balance
$184,985
Interest Rate
4.09%
Mortgage Type
New Conventional
Estimated Equity
$352,884
Purchase Details
Closed on
May 8, 2012
Sold by
Shapiro Mark P
Bought by
Fitzhugh Jennifer
Purchase Details
Closed on
Sep 9, 2009
Sold by
Shapiro Mark P
Bought by
Shapiro Mark P and Shapiro Faren M
Purchase Details
Closed on
Aug 22, 2008
Bought by
Shapiro Mark P
Home Financials for this Owner
Home Financials are based on the most recent Mortgage that was taken out on this home.
Original Mortgage
$238,400
Interest Rate
6.25%
Mortgage Type
New Conventional
Create a Home Valuation Report for This Property
The Home Valuation Report is an in-depth analysis detailing your home's value as well as a comparison with similar homes in the area
Home Values in the Area
Average Home Value in this Area
Purchase History
| Date | Buyer | Sale Price | Title Company |
|---|---|---|---|
| Manning Richard S | $300,000 | -- | |
| Fitzhugh Jennifer | $225,000 | -- | |
| Shapiro Mark P | -- | -- | |
| Shapiro Mark P | $298,000 | -- |
Source: Public Records
Mortgage History
| Date | Status | Borrower | Loan Amount |
|---|---|---|---|
| Open | Manning Richard S | $240,000 | |
| Previous Owner | Shapiro Mark P | $238,400 |
Source: Public Records
Tax History
| Year | Tax Paid | Tax Assessment Tax Assessment Total Assessment is a certain percentage of the fair market value that is determined by local assessors to be the total taxable value of land and additions on the property. | Land | Improvement |
|---|---|---|---|---|
| 2025 | $2,033 | $162,560 | $60,000 | $102,560 |
| 2024 | $15 | $156,840 | $60,000 | $96,840 |
| 2023 | $1,454 | $153,600 | $45,000 | $108,600 |
| 2022 | $1,873 | $143,280 | $45,000 | $98,280 |
| 2021 | $1,855 | $111,560 | $36,000 | $75,560 |
| 2020 | $1,877 | $110,040 | $36,000 | $74,040 |
| 2019 | $1,877 | $112,040 | $36,000 | $76,040 |
| 2018 | $1,852 | $105,280 | $36,000 | $69,280 |
| 2017 | $1,680 | $90,520 | $44,880 | $45,640 |
| 2016 | $1,657 | $89,960 | $44,880 | $45,080 |
| 2015 | $1,654 | $81,600 | $46,520 | $35,080 |
| 2014 | $3,181 | $64,360 | $0 | $0 |
Source: Public Records
Map
Nearby Homes
Your Personal Tour Guide
Ask me questions while you tour the home.