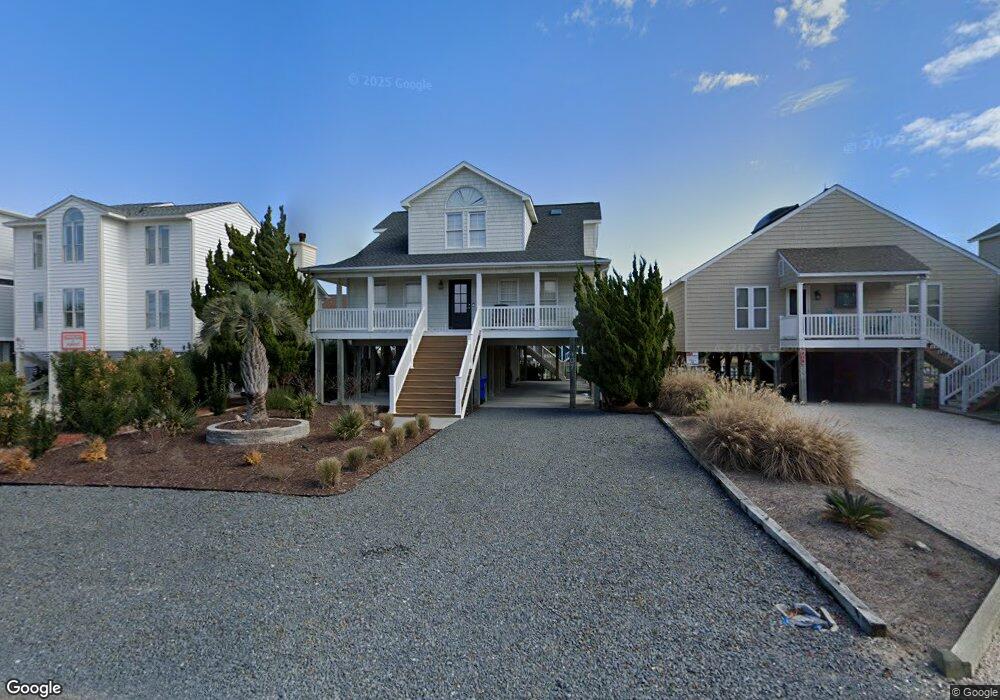
407 6th St Sunset Beach, NC 28468
Estimated Value: $928,000 - $1,351,000
4
Beds
4
Baths
2,301
Sq Ft
$515/Sq Ft
Est. Value
About This Home
This home is located at 407 6th St, Sunset Beach, NC 28468 and is currently estimated at $1,184,789, approximately $514 per square foot. 407 6th St is a home located in Brunswick County with nearby schools including Jessie Mae Monroe Elementary School, Shallotte Middle School, and West Brunswick High School.
Ownership History
Date
Name
Owned For
Owner Type
Purchase Details
Closed on
Feb 6, 2009
Sold by
Fakelmann Mary S and Fakelmann Robert J
Bought by
York James Johnson and York Tammy Taylor
Current Estimated Value
Home Financials for this Owner
Home Financials are based on the most recent Mortgage that was taken out on this home.
Original Mortgage
$416,500
Outstanding Balance
$262,996
Interest Rate
5.08%
Mortgage Type
Purchase Money Mortgage
Estimated Equity
$921,793
Purchase Details
Closed on
Feb 22, 2005
Sold by
Fakelmann Robert J
Bought by
Fakelmann Mary S
Create a Home Valuation Report for This Property
The Home Valuation Report is an in-depth analysis detailing your home's value as well as a comparison with similar homes in the area
Home Values in the Area
Average Home Value in this Area
Purchase History
| Date | Buyer | Sale Price | Title Company |
|---|---|---|---|
| York James Johnson | $600,000 | None Available | |
| Fakelmann Mary S | -- | None Available |
Source: Public Records
Mortgage History
| Date | Status | Borrower | Loan Amount |
|---|---|---|---|
| Open | York James Johnson | $416,500 |
Source: Public Records
Tax History
| Year | Tax Paid | Tax Assessment Tax Assessment Total Assessment is a certain percentage of the fair market value that is determined by local assessors to be the total taxable value of land and additions on the property. | Land | Improvement |
|---|---|---|---|---|
| 2025 | $5,355 | $986,960 | $390,000 | $596,960 |
| 2024 | $54 | $986,960 | $390,000 | $596,960 |
| 2023 | $4,431 | $986,960 | $390,000 | $596,960 |
| 2022 | $4,431 | $625,200 | $210,000 | $415,200 |
| 2021 | $4,431 | $625,200 | $210,000 | $415,200 |
| 2020 | $4,431 | $625,200 | $210,000 | $415,200 |
| 2019 | $4,431 | $218,850 | $210,000 | $8,850 |
| 2018 | $4,217 | $240,020 | $235,000 | $5,020 |
| 2017 | $4,165 | $240,020 | $235,000 | $5,020 |
| 2016 | $4,115 | $240,020 | $235,000 | $5,020 |
| 2015 | $4,115 | $607,000 | $235,000 | $372,000 |
| 2014 | $3,503 | $603,201 | $374,500 | $228,701 |
Source: Public Records
Map
Nearby Homes
- 427 6th St
- 405 5th St
- 505 E North Shore Dr
- 1534 Riverside Dr
- 1532 Riverside Dr
- 430 3rd St
- 402 Dolphin St
- 425 Dolphin St
- 410 2nd St
- 409 27th St Unit D
- 405 27th St Unit B
- 411 27th St Unit B
- 1212 E Main St
- 413 27th St Unit B
- Lot 62 Riverside Dr
- 204 W Main St
- 203 W Main St
- 1405 Canal Dr
- 402 17th St
- 403 17th St
Your Personal Tour Guide
Ask me questions while you tour the home.