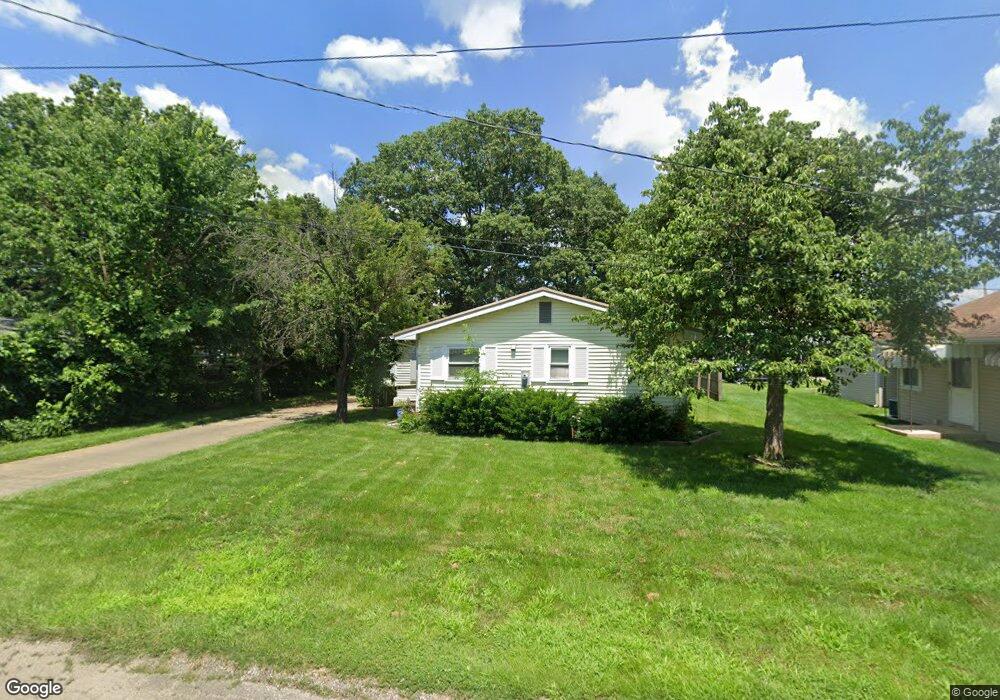
407 Allen Ln SW New Philadelphia, OH 44663
Estimated Value: $94,000 - $146,000
2
Beds
1
Bath
1,044
Sq Ft
$125/Sq Ft
Est. Value
About This Home
This home is located at 407 Allen Ln SW, New Philadelphia, OH 44663 and is currently estimated at $130,139, approximately $124 per square foot. 407 Allen Ln SW is a home located in Tuscarawas County with nearby schools including New Philadelphia High School, Quaker Preparatory Academy, and Quaker Digital Academy.
Ownership History
Date
Name
Owned For
Owner Type
Purchase Details
Closed on
Nov 7, 2022
Sold by
Beaber Joanne
Bought by
Beaber Jerry L
Current Estimated Value
Purchase Details
Closed on
Dec 19, 2016
Sold by
Beaber Joanne and Beaber Jerry L
Bought by
Beaber Joanne and Beaber Jerry L
Purchase Details
Closed on
Aug 5, 1996
Sold by
Wilson Ronald B
Bought by
Crowell James E
Home Financials for this Owner
Home Financials are based on the most recent Mortgage that was taken out on this home.
Original Mortgage
$55,000
Interest Rate
8.33%
Mortgage Type
New Conventional
Purchase Details
Closed on
Jan 29, 1993
Bought by
Beaber Jerry L
Purchase Details
Closed on
Oct 15, 1991
Sold by
Halstead Ruth C and Stri Rebecca
Bought by
Festi Bonnie M and Kannard Vivian
Purchase Details
Closed on
Jan 2, 1991
Sold by
Halstead Ruth C
Bought by
Halstead Ruth C and Rebecca Stri
Create a Home Valuation Report for This Property
The Home Valuation Report is an in-depth analysis detailing your home's value as well as a comparison with similar homes in the area
Home Values in the Area
Average Home Value in this Area
Purchase History
| Date | Buyer | Sale Price | Title Company |
|---|---|---|---|
| Beaber Jerry L | -- | -- | |
| Beaber Jerry L | -- | None Listed On Document | |
| Beaber Joanne | -- | Entrust Title | |
| Crowell James E | $57,900 | -- | |
| Beaber Jerry L | $50,000 | -- | |
| Festi Bonnie M | $40,000 | -- | |
| Halstead Ruth C | -- | -- |
Source: Public Records
Mortgage History
| Date | Status | Borrower | Loan Amount |
|---|---|---|---|
| Previous Owner | Crowell James E | $55,000 |
Source: Public Records
Tax History Compared to Growth
Tax History
| Year | Tax Paid | Tax Assessment Tax Assessment Total Assessment is a certain percentage of the fair market value that is determined by local assessors to be the total taxable value of land and additions on the property. | Land | Improvement |
|---|---|---|---|---|
| 2024 | $846 | $31,750 | $10,310 | $21,440 |
| 2023 | $846 | $90,730 | $29,470 | $61,260 |
| 2022 | $895 | $31,756 | $10,315 | $21,441 |
| 2021 | $665 | $24,780 | $9,779 | $15,001 |
| 2020 | $668 | $24,780 | $9,779 | $15,001 |
| 2019 | $668 | $24,780 | $9,779 | $15,001 |
| 2018 | $532 | $20,910 | $8,250 | $12,660 |
| 2017 | $527 | $20,910 | $8,250 | $12,660 |
| 2016 | $535 | $20,910 | $8,250 | $12,660 |
| 2014 | $533 | $20,400 | $7,430 | $12,970 |
| 2013 | $445 | $20,400 | $7,430 | $12,970 |
Source: Public Records
Map
Nearby Homes
- 405 Front Ave SW
- 514 Front Ave SW
- 241 Saint Clair Ave SW
- 651 Front Ave SW
- 360 3rd St NW
- 402 4th St NW
- 403 5th St NW
- 902 W High Ave
- 419 3rd St NW
- 348 N Broadway St
- 239 E High Ave Unit A
- 944 Grant Ave NW
- 132 North Ave NE
- 633 4th St NW
- 240 3rd St NE
- 836 Miller Ave NW
- 324 Belmont Ave NW
- 725 Kaderly St NW
- 416 2nd Dr NE
- 451 Mill Ave SE