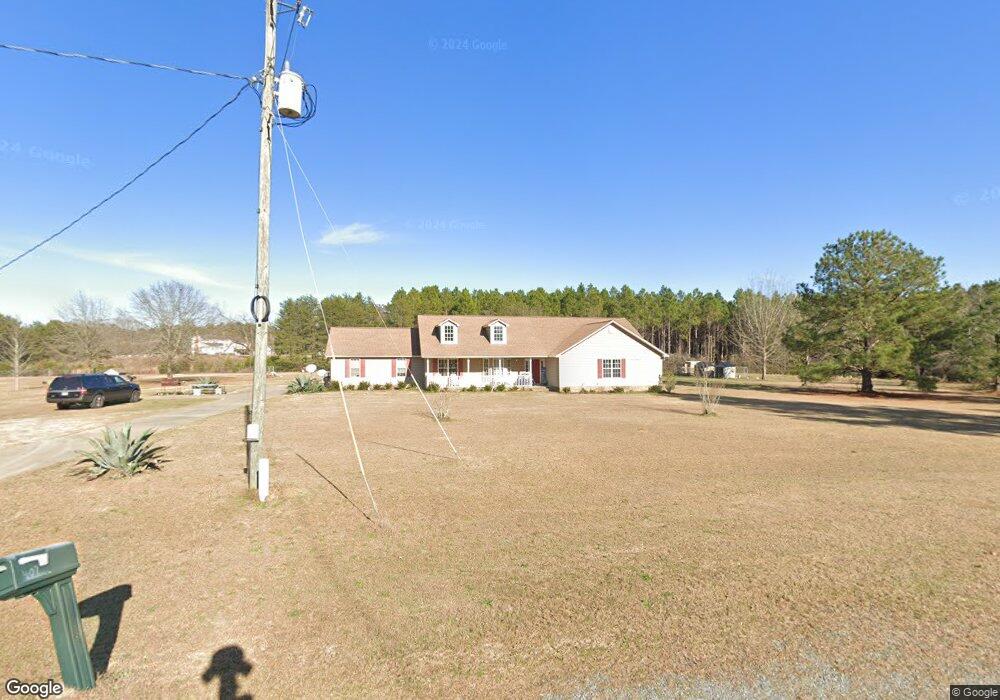
407 Briargate Dr East Dublin, GA 31027
Estimated Value: $233,000 - $370,000
4
Beds
3
Baths
2,826
Sq Ft
$107/Sq Ft
Est. Value
About This Home
This home is located at 407 Briargate Dr, East Dublin, GA 31027 and is currently estimated at $301,317, approximately $106 per square foot. 407 Briargate Dr is a home located in Laurens County with nearby schools including Northwest Laurens Elementary School, Southwest Laurens Elementary School, and East Laurens Primary School.
Ownership History
Date
Name
Owned For
Owner Type
Purchase Details
Closed on
Nov 20, 2006
Sold by
Mid State Homes Inc
Bought by
Dozier James Ronald
Current Estimated Value
Home Financials for this Owner
Home Financials are based on the most recent Mortgage that was taken out on this home.
Original Mortgage
$200,000
Outstanding Balance
$119,098
Interest Rate
6.33%
Mortgage Type
New Conventional
Estimated Equity
$182,219
Purchase Details
Closed on
Nov 16, 2006
Sold by
Mid State Homes Inc
Bought by
Dozier James Ronald
Home Financials for this Owner
Home Financials are based on the most recent Mortgage that was taken out on this home.
Original Mortgage
$200,000
Outstanding Balance
$119,098
Interest Rate
6.33%
Mortgage Type
New Conventional
Estimated Equity
$182,219
Purchase Details
Closed on
Jul 13, 2006
Sold by
Parrish Capital Reso
Bought by
Midstate Homes Inc
Purchase Details
Closed on
Mar 1, 2000
Sold by
Moorman Moorman and Moorman Watson
Bought by
Parrish Capital Reso
Create a Home Valuation Report for This Property
The Home Valuation Report is an in-depth analysis detailing your home's value as well as a comparison with similar homes in the area
Home Values in the Area
Average Home Value in this Area
Purchase History
| Date | Buyer | Sale Price | Title Company |
|---|---|---|---|
| Dozier James Ronald | $200,000 | -- | |
| Dozier James Ronald | $200,000 | -- | |
| Midstate Homes Inc | $15,000 | -- | |
| Parrish Capital Reso | -- | -- |
Source: Public Records
Mortgage History
| Date | Status | Borrower | Loan Amount |
|---|---|---|---|
| Open | Dozier James Ronald | $200,000 |
Source: Public Records
Tax History Compared to Growth
Tax History
| Year | Tax Paid | Tax Assessment Tax Assessment Total Assessment is a certain percentage of the fair market value that is determined by local assessors to be the total taxable value of land and additions on the property. | Land | Improvement |
|---|---|---|---|---|
| 2024 | $2,074 | $100,533 | $6,300 | $94,233 |
| 2023 | $1,920 | $92,402 | $9,000 | $83,402 |
| 2022 | $1,970 | $92,402 | $9,000 | $83,402 |
| 2021 | $1,543 | $70,495 | $7,200 | $63,295 |
| 2020 | $1,545 | $70,495 | $7,200 | $63,295 |
| 2019 | $1,546 | $70,495 | $7,200 | $63,295 |
| 2018 | $1,548 | $70,495 | $7,200 | $63,295 |
| 2017 | $1,546 | $70,495 | $7,200 | $63,295 |
| 2016 | $1,548 | $70,495 | $7,200 | $63,295 |
| 2015 | $1,549 | $70,495 | $7,200 | $63,295 |
| 2014 | $1,415 | $62,858 | $4,000 | $58,858 |
Source: Public Records
Map
Nearby Homes
- 3.5 ACRES Brewton Lovett Rd
- 0 Hubert Fulford Rd Unit 22123639
- 132 Shaddock Creek Cir
- 0 Hwy 319 Unit 24360437
- 174 Ernest Stinson Rd
- 0 Ralph Keen Rd Unit 21905127
- 0 Snellbridge Rd Unit 30130
- 00 Snellbridge Rd
- 0 Snellbridge Rd Unit 10569491
- 0 Snellbridge Rd Unit 10569490
- 437 Mccord Rd
- 445 Saint Charles Dr
- 104 Long Pines Cir
- 0 Old Carter Rd
- 1739 Snellbridge Rd
- 509 Maddox Rd
- 532 Ned Collins Rd
- LOT 4 Wind Song Dr
- 335 Windsong Dr
- 0 Hillcrest Dr Unit 22383
- Lot 5 Briargate Dr
- 1133 Snellbridge Rd
- 323 Bluestone Dr
- 420 Briargate Dr
- 1161 Snellbridge Rd
- 205 Pear Orchard Rd
- 1197 Snellbridge Rd
- 0 Bluestone Dr
- 115 Bluestone Dr
- 00 Bluestone Dr
- LOT 9 Briarwater Dr
- 311 Bluestone Dr
- 204 Pear Orchard Rd
- 210 Briarwater Rd Unit 13
- 210 Briarwater Rd
- 1190 Snellbridge Rd
- 0 Briarwater Dr Unit 19490
- 0 Briarwater Dr Unit 19489
- 0 Briarwater Dr Unit 21371
- 0 Briarwater Dr Unit 11 8543015