407 Capricorn Dr Granbury, TX 76049
Estimated Value: $83,000 - $185,000
3
Beds
2
Baths
1,064
Sq Ft
$126/Sq Ft
Est. Value
About This Home
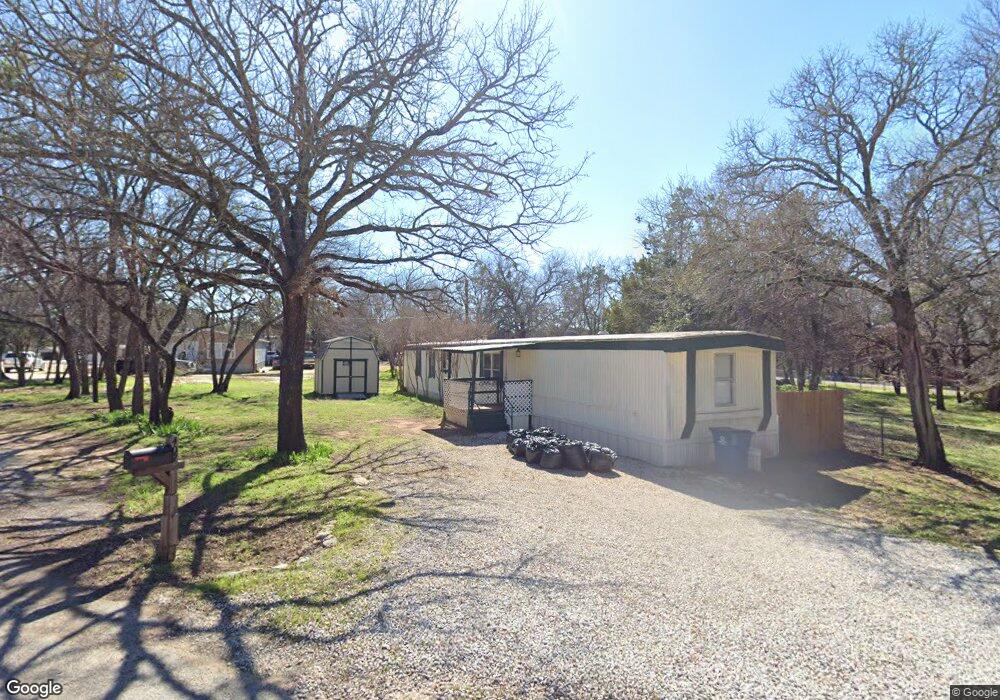
This home is located at 407 Capricorn Dr, Granbury, TX 76049 and is currently estimated at $134,000, approximately $125 per square foot. 407 Capricorn Dr is a home located in Hood County with nearby schools including Brawner Elementary School, Granbury Middle School, and Granbury High School.
Ownership History
Date
Name
Owned For
Owner Type
Purchase Details
Closed on
Feb 6, 2015
Sold by
Matsko Ronald P
Bought by
Matsko Ronald P
Current Estimated Value
Purchase Details
Closed on
Nov 4, 2008
Sold by
Patterson Jonathan and Patterson Maria
Bought by
Matsko Ronald P
Purchase Details
Closed on
Jan 5, 2007
Sold by
Matsko Bonnie
Bought by
Patterson Jonathan and Patterson Maria
Purchase Details
Closed on
Aug 6, 1998
Sold by
Matsko Ronald P
Bought by
Matsko Bonnie Lynn
Purchase Details
Closed on
May 12, 1994
Sold by
Williamson Wayne C and Williamson Barbara J
Bought by
Matsko Ronald P
Purchase Details
Closed on
Feb 26, 1993
Sold by
Budget Mobile Home
Bought by
Matsko Ronald P
Purchase Details
Closed on
Aug 7, 1992
Sold by
General Electric Capital Corp
Bought by
Matsko Ronald P
Purchase Details
Closed on
Dec 13, 1985
Sold by
Gregg Billy K
Bought by
Matsko Ronald P
Create a Home Valuation Report for This Property
The Home Valuation Report is an in-depth analysis detailing your home's value as well as a comparison with similar homes in the area
Home Values in the Area
Average Home Value in this Area
Purchase History
| Date | Buyer | Sale Price | Title Company |
|---|---|---|---|
| Matsko Ronald P | -- | None Available | |
| Matsko Ronald P | -- | None Available | |
| Matsko Ronald P | -- | None Available | |
| Patterson Jonathan | -- | None Available | |
| Matsko Bonnie Lynn | -- | None Available | |
| Matsko Ronald P | -- | -- | |
| Matsko Ronald P | -- | -- | |
| Matsko Ronald P | -- | -- | |
| Matsko Ronald P | -- | -- |
Source: Public Records
Tax History Compared to Growth
Tax History
| Year | Tax Paid | Tax Assessment Tax Assessment Total Assessment is a certain percentage of the fair market value that is determined by local assessors to be the total taxable value of land and additions on the property. | Land | Improvement |
|---|---|---|---|---|
| 2025 | $240 | $20,000 | $15,000 | $5,000 |
| 2024 | $243 | $20,000 | $15,000 | $5,000 |
| 2023 | $243 | $20,000 | $15,000 | $5,000 |
| 2022 | $146 | $11,000 | $6,000 | $5,000 |
| 2021 | $169 | $11,000 | $6,000 | $5,000 |
| 2020 | $116 | $7,500 | $2,500 | $5,000 |
| 2019 | $122 | $7,500 | $2,500 | $5,000 |
| 2018 | $53 | $3,250 | $2,500 | $750 |
| 2017 | $54 | $3,250 | $2,500 | $750 |
| 2016 | $54 | $3,250 | $2,500 | $750 |
| 2015 | $54 | $3,250 | $2,500 | $750 |
| 2014 | $54 | $3,250 | $2,500 | $750 |
Source: Public Records
Map
Nearby Homes
- 329 Capricorn Dr
- 418 S Capricorn
- 3107 Scorpio Dr
- 3018 Scorpio Dr
- 2910 Scorpio Dr
- 505 S Sky Ct
- 314 Capricorn Dr
- 325 Capricorn Dr
- 416 Capricorn Dr
- 327 Capricorn Dr
- 2012 Sky Ln
- 514 Gemini Ct
- 2915 Sagittarius Ln
- 417 Sky Harbour Ct
- 419 Sky Harbour Ct
- 3011 N Sky Ct
- 616 W Aquarius Ct
- Lot 54 W Aquarius Ct
- 414 Granada Calle Ct
- 3012 Moon Ct
- 3025 Scorpio Dr
- 411 Capricorn Dr
- 3023 Scorpio Dr
- 609 Lunar Cir
- 607 Lunar Cir
- 3103 Scorpio Dr
- 605 Lunar Cir
- 3019 Scorpio Dr
- 303 Capricorn Dr
- 416-418 S Capricorn
- 615 Lunar Cir
- 616 Lunar Cir
- 3106 Scorpio Dr
- 3109 Scorpio Dr
- 601 Lunar Cir
- 602 Lunar Cir
- 3122 Sky Harbour Dr
- 619 Lunar Cir
- 3029 Libra Dr
- 622 Lunar Cir