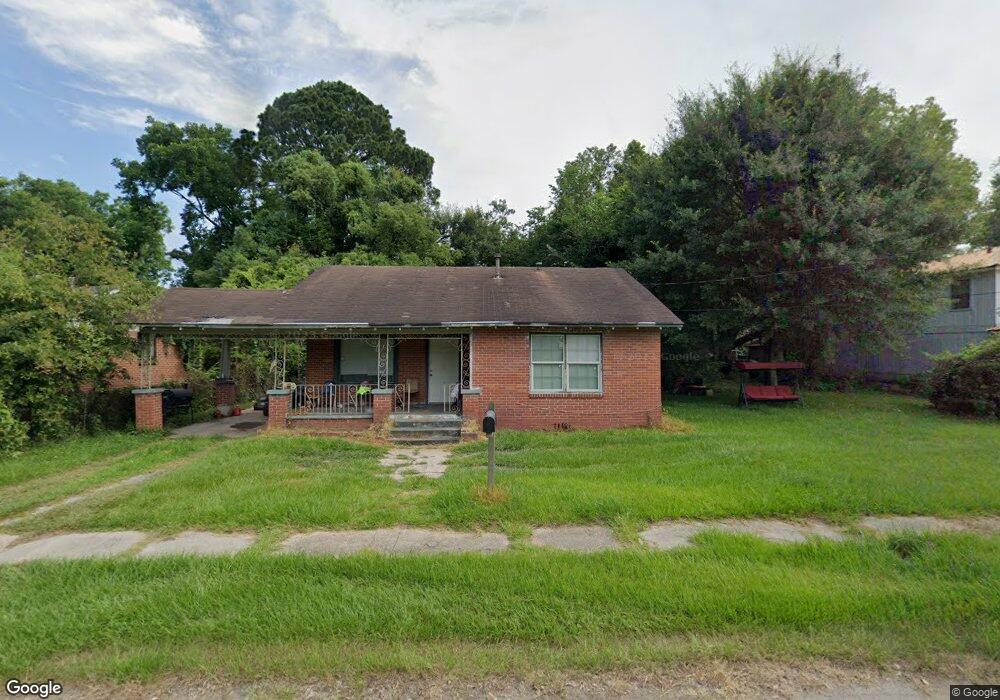
407 Clancy St Mobile, AL 36610
East Prichard NeighborhoodEstimated Value: $52,000 - $70,000
3
Beds
2
Baths
1,234
Sq Ft
$49/Sq Ft
Est. Value
About This Home
This home is located at 407 Clancy St, Mobile, AL 36610 and is currently estimated at $60,964, approximately $49 per square foot. 407 Clancy St is a home located in Mobile County with nearby schools including Grant Elementary School, Mobile Co Training Middle School, and Vigor High School.
Ownership History
Date
Name
Owned For
Owner Type
Purchase Details
Closed on
Nov 5, 2024
Sold by
Prim Phyllis
Bought by
Coleman Monta
Current Estimated Value
Purchase Details
Closed on
Mar 7, 2016
Sold by
Wright Alfred L
Bought by
Prim Darius
Purchase Details
Closed on
Jun 8, 2012
Sold by
Davis Don
Bought by
Wright Alfred L
Purchase Details
Closed on
Sep 26, 2000
Sold by
Pace Investments Inc
Bought by
Black Tamika P
Home Financials for this Owner
Home Financials are based on the most recent Mortgage that was taken out on this home.
Original Mortgage
$35,000
Interest Rate
12%
Mortgage Type
Seller Take Back
Purchase Details
Closed on
Aug 28, 2000
Sold by
Minnie Goodwin
Bought by
Pace Investments Inc
Home Financials for this Owner
Home Financials are based on the most recent Mortgage that was taken out on this home.
Original Mortgage
$35,000
Interest Rate
12%
Mortgage Type
Seller Take Back
Create a Home Valuation Report for This Property
The Home Valuation Report is an in-depth analysis detailing your home's value as well as a comparison with similar homes in the area
Home Values in the Area
Average Home Value in this Area
Purchase History
We collect this data history from publicly available records. To have your information removed, we recommend requesting removal directly through your county’s website.
| Date | Buyer | Sale Price | Title Company |
|---|---|---|---|
| Coleman Monta | $10,000 | None Listed On Document | |
| Coleman Monta | $10,000 | None Listed On Document | |
| Prim Darius | $1,000 | None Available | |
| Wright Alfred L | $769 | None Available | |
| Black Tamika P | $37,500 | -- | |
| Pace Investments Inc | -- | -- |
Source: Public Records
Mortgage History
We collect this data history from publicly available records. To have your information removed, we recommend requesting removal directly through your county’s website.
| Date | Status | Borrower | Loan Amount |
|---|---|---|---|
| Previous Owner | Black Tamika P | $35,000 |
Source: Public Records
Tax History
| Year | Tax Paid | Tax Assessment Tax Assessment Total Assessment is a certain percentage of the fair market value that is determined by local assessors to be the total taxable value of land and additions on the property. | Land | Improvement |
|---|---|---|---|---|
| 2025 | $295 | $2,320 | $400 | $1,920 |
| 2024 | $295 | $4,480 | $500 | $3,980 |
| 2023 | $295 | $4,800 | $1,000 | $3,800 |
| 2022 | $274 | $4,460 | $1,000 | $3,460 |
| 2021 | $274 | $4,460 | $1,000 | $3,460 |
| 2020 | $203 | $3,300 | $1,000 | $2,300 |
| 2019 | $200 | $3,260 | $1,000 | $2,260 |
| 2018 | $200 | $3,260 | $0 | $0 |
| 2017 | $0 | $3,260 | $0 | $0 |
| 2016 | $199 | $3,240 | $0 | $0 |
| 2013 | $187 | $3,040 | $0 | $0 |
Source: Public Records
Map
Nearby Homes
- 331 Irby St
- 38 Flock Ave
- 519 Coal St
- 228 Birmingham St
- 510 Iowa Ave
- 802 E Elm St
- 963 Semler St
- 103 W Love Joy Loop
- 541 Chandler St
- 228 Bronner St
- 317 W Main St
- 814 Beck Ave
- 1112 Newman Ln
- 220 Sinclair Ave
- 2316 Osage St
- 864 Grimes St
- 869 Edwards St
- 865 Edwards St
- 0 N Wilson Ave Unit 7685671
- 0 N Wilson Ave Unit 388456
- 329 Clancy St
- 403 Clancy St
- 325 Clancy St
- 321 Clancy St
- 420 Bay Bridge Rd
- 420 Bay Bridge Rd
- 319 Clancy St
- 326 Clancy St
- 432 Bay Bridge Rd
- 411 Clancy St
- 414 Bay Bridge Rd
- 434 Bay Bridge Rd
- 318 Clancy St
- 406 Clancy St
- 406 W Bay Bridge Rd
- 308 Polar St
- 444 Bay Bridge Rd
- 311 Clancy St
- 415 Clancy St
- 448 Bay Bridge Rd
Your Personal Tour Guide
Ask me questions while you tour the home.