Estimated Value: $95,725 - $138,000
3
Beds
--
Bath
1,400
Sq Ft
$79/Sq Ft
Est. Value
About This Home
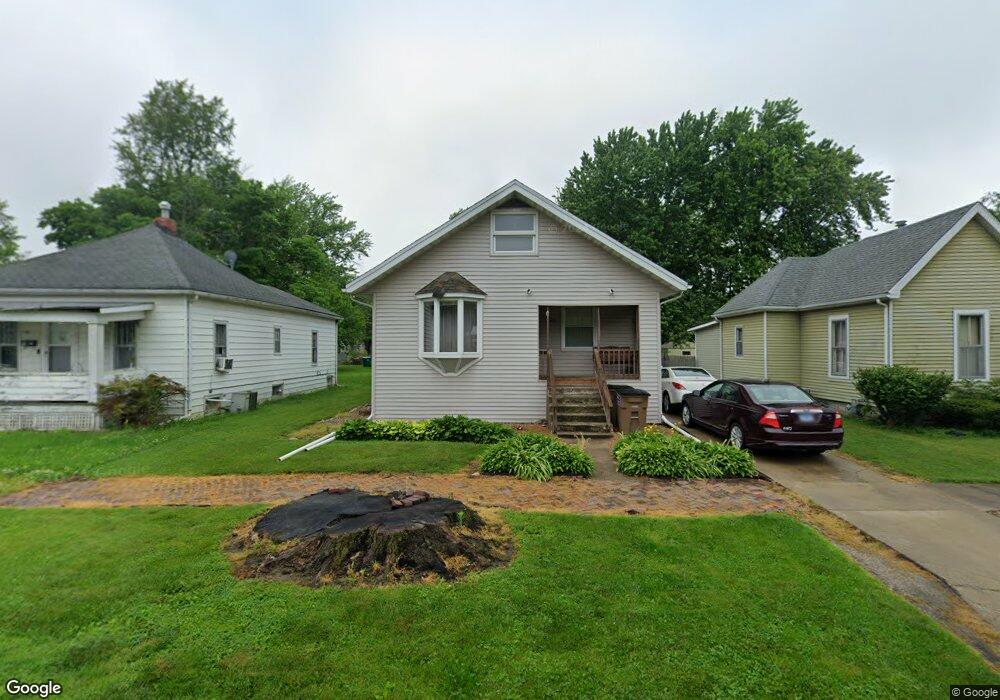
This home is located at 407 Clark St, Pana, IL 62557 and is currently estimated at $110,931, approximately $79 per square foot. 407 Clark St is a home located in Christian County with nearby schools including Washington Elementary School, Lincoln Elementary School, and Pana Jr High School.
Ownership History
Date
Name
Owned For
Owner Type
Purchase Details
Closed on
Dec 4, 2015
Sold by
Minard Danielle and White Paul D
Bought by
White Danielle and White Paul D
Current Estimated Value
Purchase Details
Closed on
Aug 17, 2007
Sold by
Dowdy Kristol D and Dowdy Bland Kristol
Bought by
Minard Danielle
Home Financials for this Owner
Home Financials are based on the most recent Mortgage that was taken out on this home.
Original Mortgage
$59,150
Outstanding Balance
$37,508
Interest Rate
6.69%
Mortgage Type
New Conventional
Estimated Equity
$73,423
Create a Home Valuation Report for This Property
The Home Valuation Report is an in-depth analysis detailing your home's value as well as a comparison with similar homes in the area
Home Values in the Area
Average Home Value in this Area
Purchase History
| Date | Buyer | Sale Price | Title Company |
|---|---|---|---|
| White Danielle | -- | None Available | |
| Minard Danielle | $56,500 | Advanced Title Group Inc |
Source: Public Records
Mortgage History
| Date | Status | Borrower | Loan Amount |
|---|---|---|---|
| Open | Minard Danielle | $59,150 |
Source: Public Records
Tax History
| Year | Tax Paid | Tax Assessment Tax Assessment Total Assessment is a certain percentage of the fair market value that is determined by local assessors to be the total taxable value of land and additions on the property. | Land | Improvement |
|---|---|---|---|---|
| 2024 | $2,125 | $27,881 | $2,074 | $25,807 |
| 2023 | $2,008 | $26,343 | $1,960 | $24,383 |
| 2022 | $2,054 | $26,017 | $1,946 | $24,071 |
| 2021 | $1,998 | $25,507 | $1,908 | $23,599 |
| 2020 | $1,918 | $24,425 | $1,827 | $22,598 |
| 2019 | $1,945 | $25,000 | $1,870 | $23,130 |
| 2018 | $1,396 | $19,688 | $1,828 | $17,860 |
| 2017 | $1,417 | $20,089 | $1,865 | $18,224 |
| 2016 | $1,400 | $20,033 | $1,860 | $18,173 |
| 2015 | $1,391 | $19,801 | $1,839 | $17,962 |
| 2014 | $881 | $18,417 | $1,710 | $16,707 |
| 2013 | $883 | $19,526 | $1,710 | $17,816 |
| 2011 | $883 | $19,987 | $1,750 | $18,237 |
Source: Public Records
Map
Nearby Homes