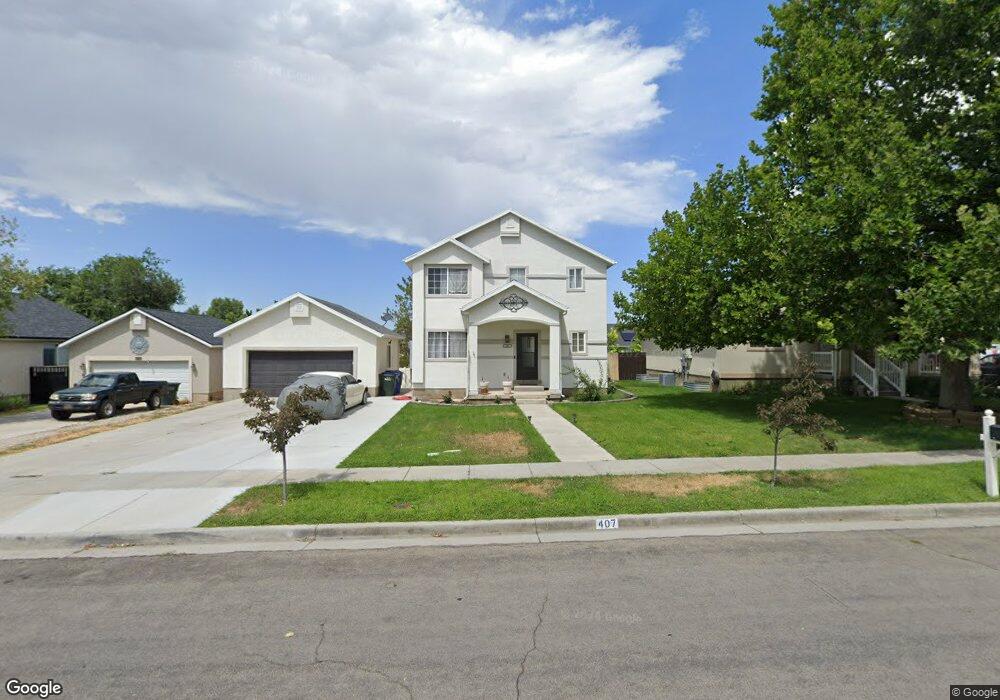
407 E 670 N Tooele, UT 84074
Estimated Value: $372,000 - $394,000
3
Beds
2
Baths
1,378
Sq Ft
$278/Sq Ft
Est. Value
About This Home
This home is located at 407 E 670 N, Tooele, UT 84074 and is currently estimated at $383,560, approximately $278 per square foot. 407 E 670 N is a home located in Tooele County with nearby schools including Sterling Elementary School, Tooele Junior High School, and Tooele High School.
Ownership History
Date
Name
Owned For
Owner Type
Purchase Details
Closed on
Jul 26, 2021
Sold by
Brunson Lori J and Brunson Frank L
Bought by
Taimani Starfordshire
Current Estimated Value
Home Financials for this Owner
Home Financials are based on the most recent Mortgage that was taken out on this home.
Original Mortgage
$348,570
Outstanding Balance
$317,100
Interest Rate
2.93%
Mortgage Type
FHA
Estimated Equity
$66,460
Purchase Details
Closed on
Sep 23, 2015
Sold by
Tessier Richard T and Tessier Heidi M
Bought by
Ogaard Lori J and Brunson Frank L
Home Financials for this Owner
Home Financials are based on the most recent Mortgage that was taken out on this home.
Original Mortgage
$164,465
Interest Rate
4.12%
Mortgage Type
FHA
Create a Home Valuation Report for This Property
The Home Valuation Report is an in-depth analysis detailing your home's value as well as a comparison with similar homes in the area
Home Values in the Area
Average Home Value in this Area
Purchase History
| Date | Buyer | Sale Price | Title Company |
|---|---|---|---|
| Taimani Starfordshire | -- | Invest Title Tooele Office | |
| Ogaard Lori J | -- | None Available |
Source: Public Records
Mortgage History
| Date | Status | Borrower | Loan Amount |
|---|---|---|---|
| Open | Taimani Starfordshire | $348,570 | |
| Previous Owner | Ogaard Lori J | $164,465 |
Source: Public Records
Tax History Compared to Growth
Tax History
| Year | Tax Paid | Tax Assessment Tax Assessment Total Assessment is a certain percentage of the fair market value that is determined by local assessors to be the total taxable value of land and additions on the property. | Land | Improvement |
|---|---|---|---|---|
| 2025 | $2,419 | $201,802 | $55,000 | $146,802 |
| 2024 | $2,399 | $183,082 | $55,000 | $128,082 |
| 2023 | $2,399 | $185,441 | $52,383 | $133,058 |
| 2022 | $2,207 | $189,856 | $51,906 | $137,950 |
| 2021 | $1,763 | $126,879 | $20,763 | $106,116 |
| 2020 | $1,695 | $211,568 | $37,750 | $173,818 |
| 2019 | $1,594 | $195,766 | $37,750 | $158,016 |
| 2018 | $1,494 | $173,912 | $40,000 | $133,912 |
| 2017 | $1,092 | $150,822 | $31,250 | $119,572 |
| 2016 | $911 | $74,374 | $17,188 | $57,186 |
| 2015 | $911 | $66,242 | $0 | $0 |
| 2014 | -- | $66,242 | $0 | $0 |
Source: Public Records
Map
Nearby Homes
- 336 E 700 N
- 367 E 740 N
- 516 N Broadway Ave
- 635 Chimesview Cir
- 535 E 670 N
- 603 Valley View Dr
- 261 E 670 N Unit 220
- 298 E 600 N
- 252 E 715 N Unit 216
- 294 E 600 N
- 779 N 560 E
- 698 Brook Ave E
- 590 N Brook Ave
- 151 E 730 N
- 122 E 730 N Unit 105
- 118 E 730 N Unit 104
- 449 Marvista Ln
- 875 N 650 E
- 180 1000 N
- 539 N 780 E