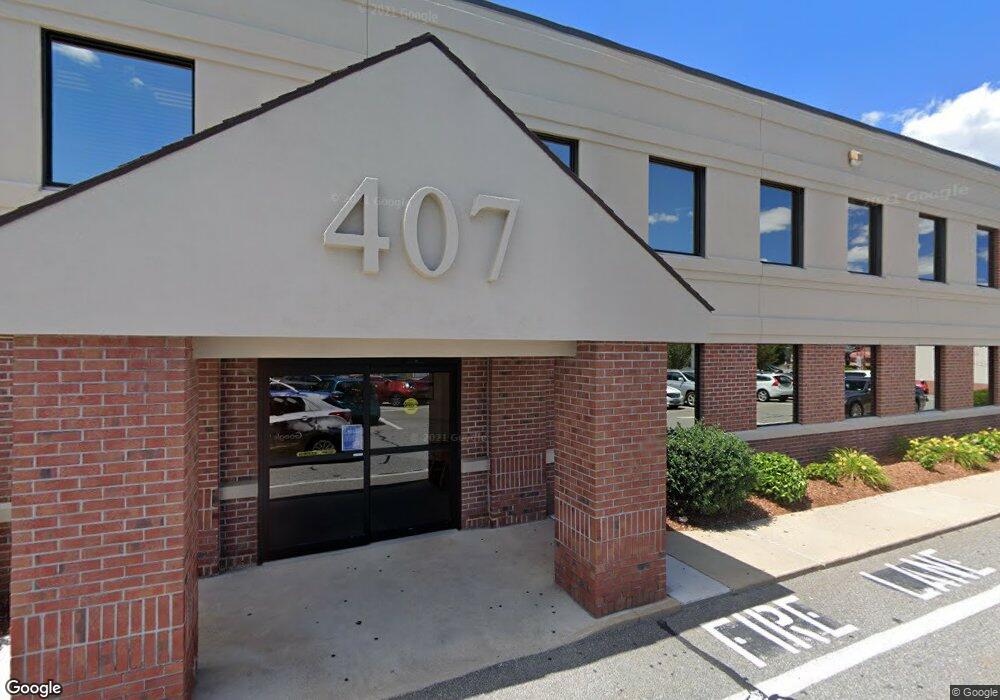
407 East Ave Pawtucket, RI 02860
Oak Hill NeighborhoodEstimated Value: $14,466,844
--
Bed
--
Bath
38,356
Sq Ft
$377/Sq Ft
Est. Value
About This Home
This home is located at 407 East Ave, Pawtucket, RI 02860 and is currently estimated at $14,466,844, approximately $377 per square foot. 407 East Ave is a home located in Providence County with nearby schools including International Charter School, Blackstone Academy Charter School, and Saint Raphael Academy.
Ownership History
Date
Name
Owned For
Owner Type
Purchase Details
Closed on
Sep 30, 2021
Sold by
407 Realty Llc
Bought by
Egmp 407 East Aenue Llc
Current Estimated Value
Home Financials for this Owner
Home Financials are based on the most recent Mortgage that was taken out on this home.
Original Mortgage
$7,837,500
Outstanding Balance
$7,115,978
Interest Rate
2.8%
Mortgage Type
Credit Line Revolving
Estimated Equity
$7,350,866
Purchase Details
Closed on
Aug 30, 1996
Sold by
Roths Rlty Co
Bought by
407 Rlty Llc
Create a Home Valuation Report for This Property
The Home Valuation Report is an in-depth analysis detailing your home's value as well as a comparison with similar homes in the area
Home Values in the Area
Average Home Value in this Area
Purchase History
| Date | Buyer | Sale Price | Title Company |
|---|---|---|---|
| Egmp 407 East Aenue Llc | $10,425,000 | None Available | |
| 407 Rlty Llc | $575,000 | -- |
Source: Public Records
Mortgage History
| Date | Status | Borrower | Loan Amount |
|---|---|---|---|
| Open | Egmp 407 East Aenue Llc | $7,837,500 |
Source: Public Records
Tax History Compared to Growth
Tax History
| Year | Tax Paid | Tax Assessment Tax Assessment Total Assessment is a certain percentage of the fair market value that is determined by local assessors to be the total taxable value of land and additions on the property. | Land | Improvement |
|---|---|---|---|---|
| 2025 | $102,597 | $4,458,800 | $1,179,700 | $3,279,100 |
| 2024 | $96,310 | $4,458,800 | $1,179,700 | $3,279,100 |
| 2023 | $109,933 | $3,707,700 | $983,100 | $2,724,600 |
| 2022 | $0 | $4,737,400 | $1,317,100 | $3,420,300 |
| 2021 | $0 | $4,737,400 | $1,317,100 | $3,420,300 |
| 2020 | $160,623 | $4,659,800 | $1,317,100 | $3,342,700 |
| 2019 | $160,623 | $4,659,800 | $1,317,100 | $3,342,700 |
| 2018 | $154,752 | $4,659,800 | $1,317,100 | $3,342,700 |
| 2017 | $156,569 | $4,488,800 | $1,340,600 | $3,148,200 |
| 2016 | $162,575 | $4,837,100 | $1,340,600 | $3,496,500 |
| 2015 | $162,575 | $4,837,100 | $1,340,600 | $3,496,500 |
| 2014 | $168,753 | $5,464,800 | $1,457,200 | $4,007,600 |
Source: Public Records
Map
Nearby Homes