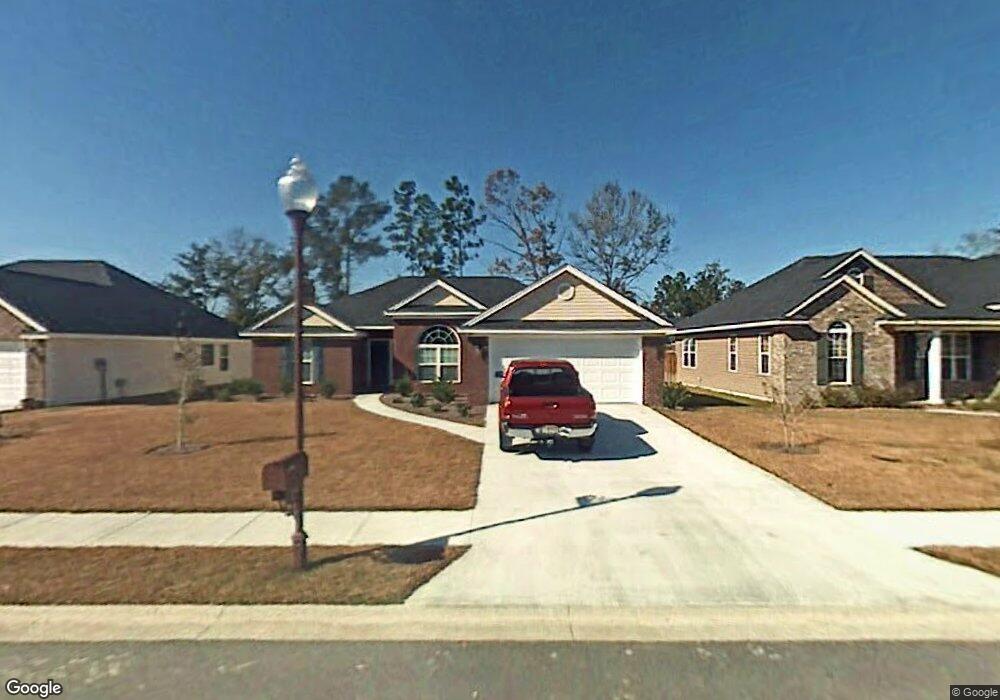
407 Gravel Way Bloomingdale, GA 31302
Estimated Value: $306,913 - $337,000
--
Bed
1
Bath
1,639
Sq Ft
$196/Sq Ft
Est. Value
About This Home
This home is located at 407 Gravel Way, Bloomingdale, GA 31302 and is currently estimated at $320,478, approximately $195 per square foot. 407 Gravel Way is a home located in Effingham County with nearby schools including Sand Hill Elementary School, South Effingham Middle School, and South Effingham High School.
Ownership History
Date
Name
Owned For
Owner Type
Purchase Details
Closed on
Jul 31, 2014
Sold by
Saxon Brian Scott
Bought by
Meyers Sean C
Current Estimated Value
Home Financials for this Owner
Home Financials are based on the most recent Mortgage that was taken out on this home.
Original Mortgage
$171,101
Outstanding Balance
$129,565
Interest Rate
4.16%
Mortgage Type
VA
Estimated Equity
$190,913
Purchase Details
Closed on
May 11, 2007
Sold by
Robertson Construction Co
Bought by
Saxon Brian Scott
Home Financials for this Owner
Home Financials are based on the most recent Mortgage that was taken out on this home.
Original Mortgage
$189,440
Interest Rate
6.17%
Mortgage Type
VA
Purchase Details
Closed on
May 11, 2005
Sold by
Amby Development Inc
Bought by
Robertson Construction Co Inc
Purchase Details
Closed on
May 5, 2005
Sold by
Amby Development Inc
Bought by
Robertson Construction Co Inc
Create a Home Valuation Report for This Property
The Home Valuation Report is an in-depth analysis detailing your home's value as well as a comparison with similar homes in the area
Home Values in the Area
Average Home Value in this Area
Purchase History
| Date | Buyer | Sale Price | Title Company |
|---|---|---|---|
| Meyers Sean C | $167,500 | -- | |
| Saxon Brian Scott | $185,000 | -- | |
| Robertson Construction Co Inc | $45,000 | -- | |
| Robertson Construction Co Inc | $35,000 | -- |
Source: Public Records
Mortgage History
| Date | Status | Borrower | Loan Amount |
|---|---|---|---|
| Open | Meyers Sean C | $171,101 | |
| Previous Owner | Saxon Brian Scott | $189,440 |
Source: Public Records
Tax History Compared to Growth
Tax History
| Year | Tax Paid | Tax Assessment Tax Assessment Total Assessment is a certain percentage of the fair market value that is determined by local assessors to be the total taxable value of land and additions on the property. | Land | Improvement |
|---|---|---|---|---|
| 2025 | $2,563 | $122,562 | $22,800 | $99,762 |
| 2024 | $2,563 | $108,373 | $22,800 | $85,573 |
| 2023 | $1,764 | $110,305 | $17,600 | $92,705 |
| 2022 | $2,259 | $94,201 | $14,000 | $80,201 |
| 2021 | $2,202 | $77,486 | $12,000 | $65,486 |
| 2020 | $2,178 | $73,981 | $12,000 | $61,981 |
| 2019 | $2,189 | $71,981 | $10,000 | $61,981 |
| 2018 | $2,155 | $67,434 | $10,000 | $57,434 |
| 2017 | $2,172 | $67,434 | $10,000 | $57,434 |
| 2016 | $2,078 | $65,328 | $10,000 | $55,328 |
| 2015 | -- | $63,328 | $8,000 | $55,328 |
| 2014 | -- | $59,808 | $6,000 | $53,808 |
| 2013 | -- | $60,808 | $7,000 | $53,808 |
Source: Public Records
Map
Nearby Homes
- 104 Sandstone Dr
- 507 Cobblestone Cir
- 511 Cobblestone Cir
- 124 Harvey Rd
- 208 Cypress Lake Dr
- 251 Oak Dr
- 205 Oak Dr
- 176 E 7th St
- 472 S Laurel Cir
- 101 Buford Hill Rd
- 444 Harvey Rd
- 338 Bay
- 160 8th St
- 195 Railroad St
- 2060 Us Highway 80
- Tract 2 Williams St
- 225 Oconee Ave
- 218 Ridge Rd
- 2301 US Highway 80
- 327 Bay Ln
- 409 Gravel Way
- 405 Gravel Way
- 224 Pebblestone Dr
- 411 Gravel Way
- 222 Pebblestone Dr
- 226 Pebblestone Dr
- 410 Gravel Way
- 408 Gravel Way
- 412 Gravel Way
- 413 Gravel Way
- 220 Pebblestone Dr
- 406 Gravel Way
- 402 Gravel Way
- 404 Gravel Way
- 414 Gravel Way
- 415 Gravel Way
- 221 Pebblestone Dr
- 218 Pebblestone Dr
- 225 Pebblestone Dr
- 219 Pebblestone Dr