Estimated Value: $55,070 - $91,000
--
Bed
1
Bath
780
Sq Ft
$87/Sq Ft
Est. Value
About This Home
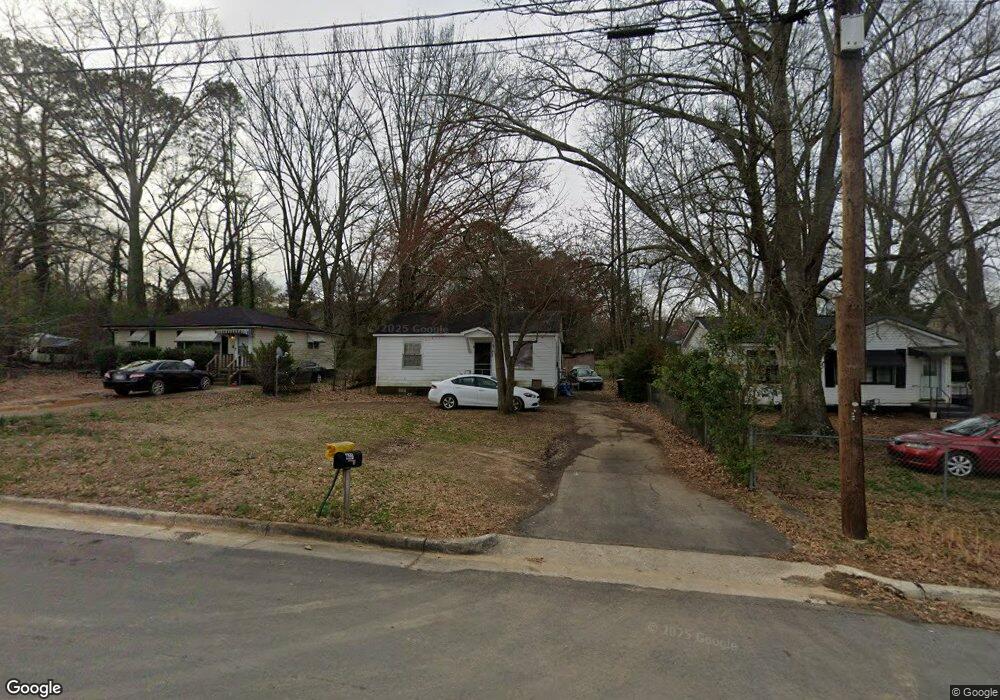
This home is located at 407 Grover St SW, Rome, GA 30161 and is currently estimated at $68,023, approximately $87 per square foot. 407 Grover St SW is a home located in Floyd County with nearby schools including Dan McCarty Middle School, Rome High School, and Darlington School.
Ownership History
Date
Name
Owned For
Owner Type
Purchase Details
Closed on
Apr 19, 2024
Sold by
Keown Charles Dee
Bought by
Homestead River Development Llc
Current Estimated Value
Purchase Details
Closed on
Apr 3, 2024
Sold by
Jan Stone Keown Trust
Bought by
Williamson James D
Purchase Details
Closed on
Apr 2, 2024
Sold by
Keown Charles Dee
Bought by
Jan Stone Keown Trust and Jennings R
Purchase Details
Closed on
Jun 20, 2003
Sold by
Youngblood E B
Bought by
Keown Charles Dee
Purchase Details
Closed on
Dec 22, 1998
Sold by
American General Finance Inc
Bought by
Youngblood E B
Purchase Details
Closed on
Feb 3, 1998
Sold by
Jones Lisha Allison
Bought by
American General Finance Inc
Purchase Details
Closed on
Jun 30, 1993
Sold by
Jones Mrs Betty Blanchard
Bought by
Jones Lisha Allison
Purchase Details
Closed on
Oct 26, 1964
Sold by
Chambers Freddie T
Bought by
Jones Mrs Betty Blanchard
Purchase Details
Closed on
Jan 1, 1901
Bought by
Chambers Freddie T
Create a Home Valuation Report for This Property
The Home Valuation Report is an in-depth analysis detailing your home's value as well as a comparison with similar homes in the area
Home Values in the Area
Average Home Value in this Area
Purchase History
| Date | Buyer | Sale Price | Title Company |
|---|---|---|---|
| Homestead River Development Llc | $40,000 | -- | |
| Williamson James D | $23,500 | -- | |
| Jan Stone Keown Trust | -- | -- | |
| Keown Charles Dee | $25,000 | -- | |
| Youngblood E B | $5,800 | -- | |
| American General Finance Inc | $13,100 | -- | |
| Jones Lisha Allison | -- | -- | |
| Jones Mrs Betty Blanchard | -- | -- | |
| Chambers Freddie T | -- | -- |
Source: Public Records
Tax History Compared to Growth
Tax History
| Year | Tax Paid | Tax Assessment Tax Assessment Total Assessment is a certain percentage of the fair market value that is determined by local assessors to be the total taxable value of land and additions on the property. | Land | Improvement |
|---|---|---|---|---|
| 2024 | $559 | $14,266 | $4,840 | $9,426 |
| 2023 | $505 | $13,406 | $4,400 | $9,006 |
| 2022 | $394 | $10,796 | $3,520 | $7,276 |
| 2021 | $314 | $8,456 | $3,520 | $4,936 |
| 2020 | $275 | $7,363 | $2,750 | $4,613 |
| 2019 | $260 | $7,020 | $2,750 | $4,270 |
| 2018 | $246 | $6,648 | $2,750 | $3,898 |
| 2017 | $239 | $6,452 | $2,750 | $3,702 |
| 2016 | $283 | $7,622 | $2,720 | $4,902 |
| 2015 | $267 | $7,622 | $2,720 | $4,902 |
| 2014 | $267 | $7,622 | $2,720 | $4,902 |
Source: Public Records
Map
Nearby Homes
- 410 Hardy Ave SW
- 218 Wilson Ave SW
- 3 Porter St SW
- 3 Grover St SW
- 529 Branham Ave SW
- 334 Branham Ave SW
- 107 Butler St SW
- 515 Harper Ave SW
- 235 Pennington Ave SW
- 110 Cherokee St SW
- 101 Hardy Ave SW
- 18 Butler St SW
- 204 Myrtle St SW
- 111 Lookout Cir SW
- 113 Lookout Cir SW
- 515 S Broad St SW
- 105 Mary St SW
- 115 Lookout Cir SW
- 11 Blacks Bluff Rd SW
- 405 Grover St SW
- 409 Grover St SW
- 0 Landrum Place SW Unit 14 8281872
- 501 Cotton Ave SW
- 411 Grover St SW
- 503 Cotton Ave SW
- 404 Grover St SW
- 402 Grover St SW
- 505 Cotton Ave SW
- 504 Wilson Ave SW
- 500 Wilson Ave SW
- 400 Grover St SW
- 420 Wilson Ave SW
- 507 Cotton Ave SW
- 3 Landrum Place SW
- 506 Wilson Ave SW
- 506 Wilson Ave SW
- 508 Wilson Ave SW
- 4 Landrum Place SW
- 418 Wilson Ave SW