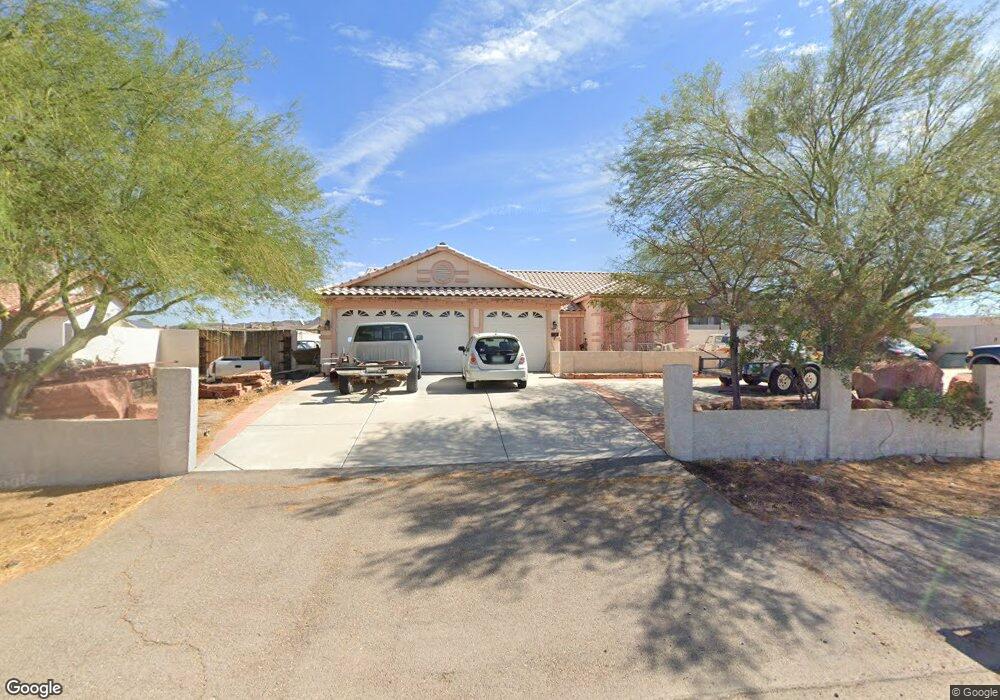
407 Hull St Henderson, NV 89015
Foothills NeighborhoodEstimated Value: $630,714 - $727,000
3
Beds
2
Baths
2,329
Sq Ft
$297/Sq Ft
Est. Value
About This Home
This home is located at 407 Hull St, Henderson, NV 89015 and is currently estimated at $692,179, approximately $297 per square foot. 407 Hull St is a home located in Clark County with nearby schools including C T Sewell Elementary School, B Mahlon Brown Academy of International Studies, and Basic Academy of International Studies.
Ownership History
Date
Name
Owned For
Owner Type
Purchase Details
Closed on
Dec 22, 1999
Sold by
U S Home Corp
Bought by
Broadway Barry L
Current Estimated Value
Home Financials for this Owner
Home Financials are based on the most recent Mortgage that was taken out on this home.
Original Mortgage
$172,300
Interest Rate
7.68%
Create a Home Valuation Report for This Property
The Home Valuation Report is an in-depth analysis detailing your home's value as well as a comparison with similar homes in the area
Home Values in the Area
Average Home Value in this Area
Purchase History
| Date | Buyer | Sale Price | Title Company |
|---|---|---|---|
| Broadway Barry L | $174,625 | Stewart Title |
Source: Public Records
Mortgage History
| Date | Status | Borrower | Loan Amount |
|---|---|---|---|
| Previous Owner | Broadway Barry L | $172,300 |
Source: Public Records
Tax History Compared to Growth
Tax History
| Year | Tax Paid | Tax Assessment Tax Assessment Total Assessment is a certain percentage of the fair market value that is determined by local assessors to be the total taxable value of land and additions on the property. | Land | Improvement |
|---|---|---|---|---|
| 2025 | $2,492 | $150,631 | $52,500 | $98,131 |
| 2024 | $2,420 | $150,631 | $52,500 | $98,131 |
| 2023 | $2,420 | $144,680 | $52,500 | $92,180 |
| 2022 | $2,350 | $130,080 | $45,500 | $84,580 |
| 2021 | $2,281 | $122,337 | $42,000 | $80,337 |
| 2020 | $2,212 | $121,634 | $42,000 | $79,634 |
| 2019 | $2,148 | $109,996 | $31,500 | $78,496 |
| 2018 | $2,085 | $96,640 | $21,000 | $75,640 |
| 2017 | $2,832 | $97,707 | $21,000 | $76,707 |
| 2016 | $1,975 | $87,709 | $21,000 | $66,709 |
| 2015 | $1,971 | $65,975 | $14,000 | $51,975 |
| 2014 | $1,913 | $66,098 | $14,000 | $52,098 |
Source: Public Records
Map
Nearby Homes