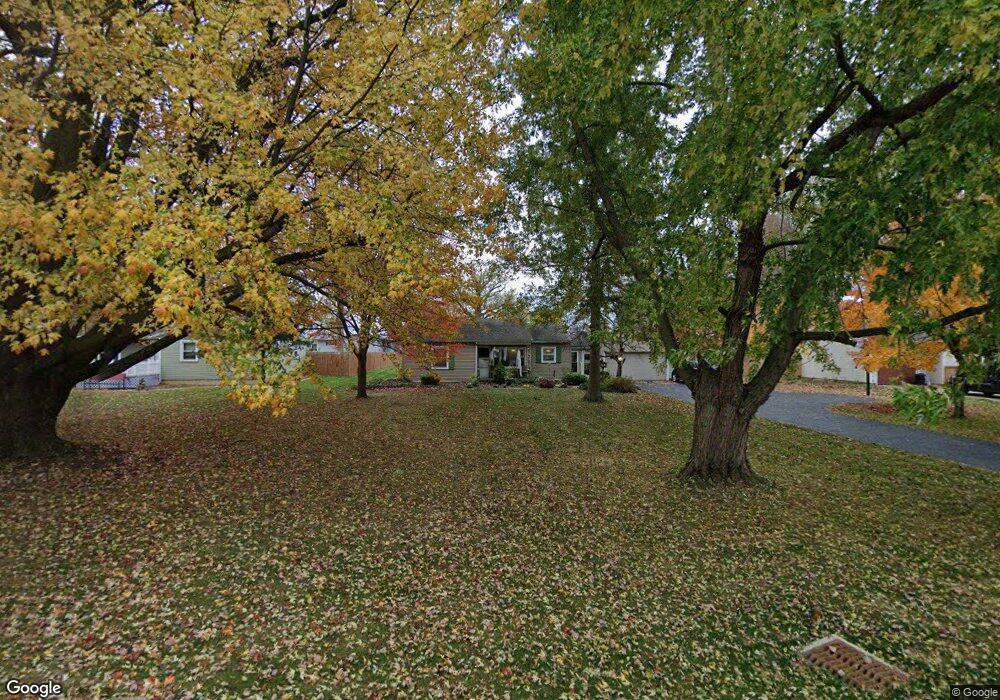
407 Infirmary Rd Wapakoneta, OH 45895
Estimated Value: $224,434 - $266,000
3
Beds
2
Baths
1,328
Sq Ft
$184/Sq Ft
Est. Value
About This Home
This home is located at 407 Infirmary Rd, Wapakoneta, OH 45895 and is currently estimated at $244,609, approximately $184 per square foot. 407 Infirmary Rd is a home located in Auglaize County with nearby schools including Wapakoneta Elementary School, Wapakoneta High School, and Wapakoneta Middle School.
Ownership History
Date
Name
Owned For
Owner Type
Purchase Details
Closed on
May 5, 2022
Sold by
Pina Thomas B
Bought by
Pina Thomas B and Pina Rhonda Rae
Current Estimated Value
Home Financials for this Owner
Home Financials are based on the most recent Mortgage that was taken out on this home.
Original Mortgage
$140,008
Outstanding Balance
$132,352
Interest Rate
4.72%
Mortgage Type
FHA
Estimated Equity
$112,257
Purchase Details
Closed on
Jul 20, 2007
Sold by
Parrett James E and Parrett Lacey J
Bought by
Pina Thomas B
Home Financials for this Owner
Home Financials are based on the most recent Mortgage that was taken out on this home.
Original Mortgage
$109,633
Interest Rate
6.54%
Mortgage Type
FHA
Purchase Details
Closed on
Feb 26, 1993
Bought by
Parrett Ii James E
Purchase Details
Closed on
Mar 11, 1991
Sold by
Frey Robert E
Bought by
Frey Kenneth E Trustee
Create a Home Valuation Report for This Property
The Home Valuation Report is an in-depth analysis detailing your home's value as well as a comparison with similar homes in the area
Home Values in the Area
Average Home Value in this Area
Purchase History
| Date | Buyer | Sale Price | Title Company |
|---|---|---|---|
| Pina Thomas B | -- | Rosenberg Lpa | |
| Pina Thomas B | $110,500 | Nw Title | |
| Parrett Ii James E | $45,500 | -- | |
| Frey Kenneth E Trustee | -- | -- |
Source: Public Records
Mortgage History
| Date | Status | Borrower | Loan Amount |
|---|---|---|---|
| Open | Pina Thomas B | $140,008 | |
| Previous Owner | Pina Thomas B | $109,633 |
Source: Public Records
Tax History Compared to Growth
Tax History
| Year | Tax Paid | Tax Assessment Tax Assessment Total Assessment is a certain percentage of the fair market value that is determined by local assessors to be the total taxable value of land and additions on the property. | Land | Improvement |
|---|---|---|---|---|
| 2024 | $2,968 | $60,880 | $14,800 | $46,080 |
| 2023 | $1,986 | $60,880 | $14,800 | $46,080 |
| 2022 | $1,523 | $43,080 | $12,260 | $30,820 |
| 2021 | $1,503 | $43,080 | $12,260 | $30,820 |
| 2020 | $764 | $43,085 | $12,264 | $30,821 |
| 2019 | $1,287 | $35,315 | $10,052 | $25,263 |
| 2018 | $1,292 | $35,315 | $10,052 | $25,263 |
| 2017 | $1,285 | $35,315 | $10,052 | $25,263 |
| 2016 | $1,253 | $34,553 | $9,573 | $24,980 |
| 2015 | $1,236 | $34,553 | $9,573 | $24,980 |
| 2014 | $1,502 | $34,553 | $9,573 | $24,980 |
| 2013 | $1,524 | $34,553 | $9,573 | $24,980 |
Source: Public Records
Map
Nearby Homes
- 322 Cole Dr
- 808 Aster Dr
- 920 Primrose Dr
- 420 Hoopengarner St
- 1028 Stonegate Ct
- 906 Aster Dr
- 1020 Timber Trail
- 924 Poppy Dr
- 0 Wapakoneta Cridersville Rd
- 17054 State Route 198
- 601 Warren St
- 9 E Silver St
- 106 Valleyview Dr
- 414 W Auglaize St
- 307 W Auglaize St
- 0 Ohio 67
- 608 W Benton St
- 814 W Benton St
- 307 W Benton St
- 201 E Pearl St
- 409 Infirmary Rd
- 405 Infirmary Rd
- 403 Infirmary Rd
- 406 Woodlawn Dr
- 404 Woodlawn Dr
- 408 Woodlawn Dr
- 402 Woodlawn Dr
- 401 Infirmary Rd
- 410 Woodlawn Dr
- 400 Woodlawn Dr
- 0 Woodlawn Dr Unit 255695
- 307 Infirmary Rd
- 307 Infirmary Rd
- 308 Woodlawn Dr
- 1606 Ohio 501
- 1606 State Route 501
- 407 Woodlawn Dr
- 405 Woodlawn Dr