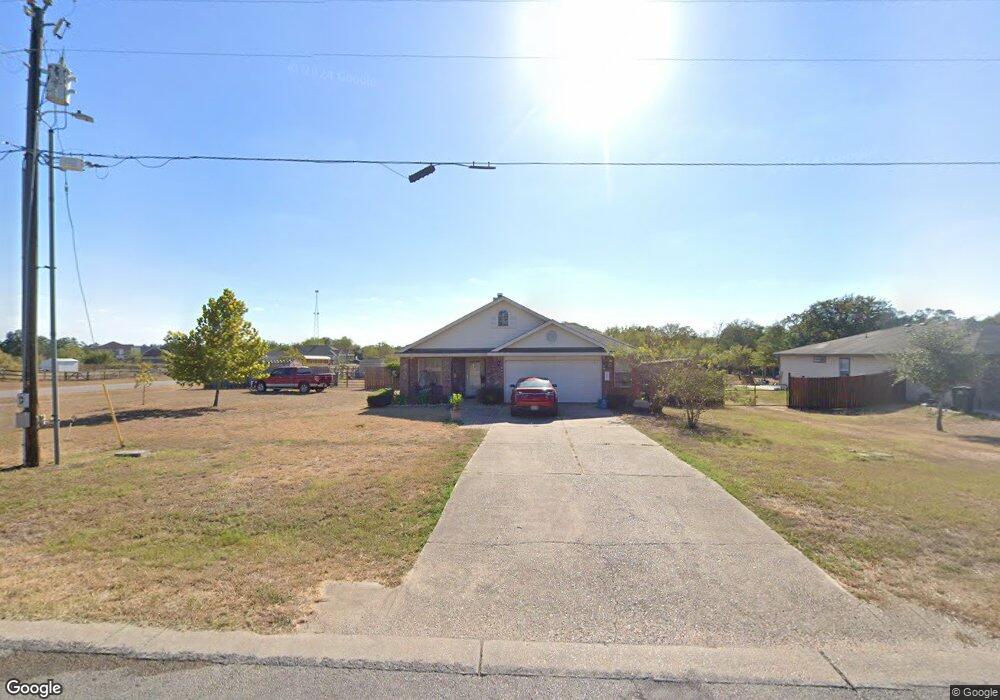
407 McDonald Ln W Cedar Creek, TX 78612
Estimated Value: $344,000 - $489,000
3
Beds
2
Baths
1,425
Sq Ft
$273/Sq Ft
Est. Value
About This Home
This home is located at 407 McDonald Ln W, Cedar Creek, TX 78612 and is currently estimated at $389,235, approximately $273 per square foot. 407 McDonald Ln W is a home located in Bastrop County with nearby schools including Bluebonnet Elementary School, Cedar Creek Middle School, and Cedar Creek Intermediate School.
Ownership History
Date
Name
Owned For
Owner Type
Purchase Details
Closed on
Aug 14, 2009
Sold by
Citibank Na
Bought by
Samarron Refugio D and Samarron Rosita V
Current Estimated Value
Home Financials for this Owner
Home Financials are based on the most recent Mortgage that was taken out on this home.
Original Mortgage
$118,808
Outstanding Balance
$77,424
Interest Rate
5.2%
Mortgage Type
FHA
Estimated Equity
$311,811
Purchase Details
Closed on
Mar 3, 2009
Sold by
Cortez Merilyn
Bought by
Citibank Na
Purchase Details
Closed on
Aug 16, 2006
Sold by
Centex Homes
Bought by
Cortez Merilyn
Home Financials for this Owner
Home Financials are based on the most recent Mortgage that was taken out on this home.
Original Mortgage
$113,509
Interest Rate
7.5%
Mortgage Type
Adjustable Rate Mortgage/ARM
Create a Home Valuation Report for This Property
The Home Valuation Report is an in-depth analysis detailing your home's value as well as a comparison with similar homes in the area
Home Values in the Area
Average Home Value in this Area
Purchase History
| Date | Buyer | Sale Price | Title Company |
|---|---|---|---|
| Samarron Refugio D | -- | None Available | |
| Citibank Na | $124,609 | None Available | |
| Cortez Merilyn | -- | Commerce Title Company |
Source: Public Records
Mortgage History
| Date | Status | Borrower | Loan Amount |
|---|---|---|---|
| Open | Samarron Refugio D | $118,808 | |
| Previous Owner | Cortez Merilyn | $113,509 |
Source: Public Records
Tax History Compared to Growth
Tax History
| Year | Tax Paid | Tax Assessment Tax Assessment Total Assessment is a certain percentage of the fair market value that is determined by local assessors to be the total taxable value of land and additions on the property. | Land | Improvement |
|---|---|---|---|---|
| 2025 | $1,268 | $363,647 | $160,986 | $202,661 |
| 2023 | $1,268 | $317,071 | $0 | $0 |
| 2022 | $2,896 | $288,246 | $0 | $0 |
| 2021 | $5,191 | $267,873 | $75,403 | $192,470 |
| 2020 | $4,862 | $243,200 | $51,431 | $191,769 |
| 2019 | $4,593 | $216,564 | $35,177 | $212,324 |
| 2018 | $4,175 | $196,876 | $35,177 | $187,299 |
| 2017 | $3,989 | $178,978 | $24,398 | $166,223 |
| 2016 | $3,627 | $162,707 | $20,162 | $209,974 |
| 2015 | $2,886 | $146,997 | $20,162 | $172,408 |
| 2014 | $2,886 | $133,634 | $17,658 | $115,976 |
Source: Public Records
Map
Nearby Homes
- 201 Murchison Dr
- 104 Martin Meadows
- TBD Della Ln
- 202 Great Northern Dr
- 157 Santa fe Trail
- 146 Santa fe Trail
- 156 Santa fe Trail
- 177 Billingsley Heights
- 106 Hobbs Creek Cove
- 182 Great Northern Dr
- 172 Great Northern Dr
- 174 Hershal Ln
- The Westley Plan at Railhead
- The Hudson Plan at Railhead
- The Dean Plan at Railhead
- The Courtland Plan at Railhead
- The Fairfield Plan at Railhead
- The Grayson Plan at Railhead
- The Coleman Plan at Railhead
- Alexandrite Plan at Railhead - Seasons
- 411 McDonald Ln W
- 415 McDonald Ln W
- 419 McDonald Ln W
- 391 McDonald Ln W
- 146 Purple Sage Dr
- 410 McDonald Ln W
- 387 McDonald Ln W
- 423 McDonald Ln W
- 145 Purple Sage Dr
- 400 McDonald Ln W
- 386 McDonald Ln W
- 427 McDonald Ln W
- 383 McDonald Ln W
- 106 Wildflower Cove
- 431 McDonald Ln W
- 104 Bent Tree Cove
- 108 Bent Tree Cove
- 379 McDonald Ln W
- 112 Bent Tree Cove
- 116 Bent Tree Cove