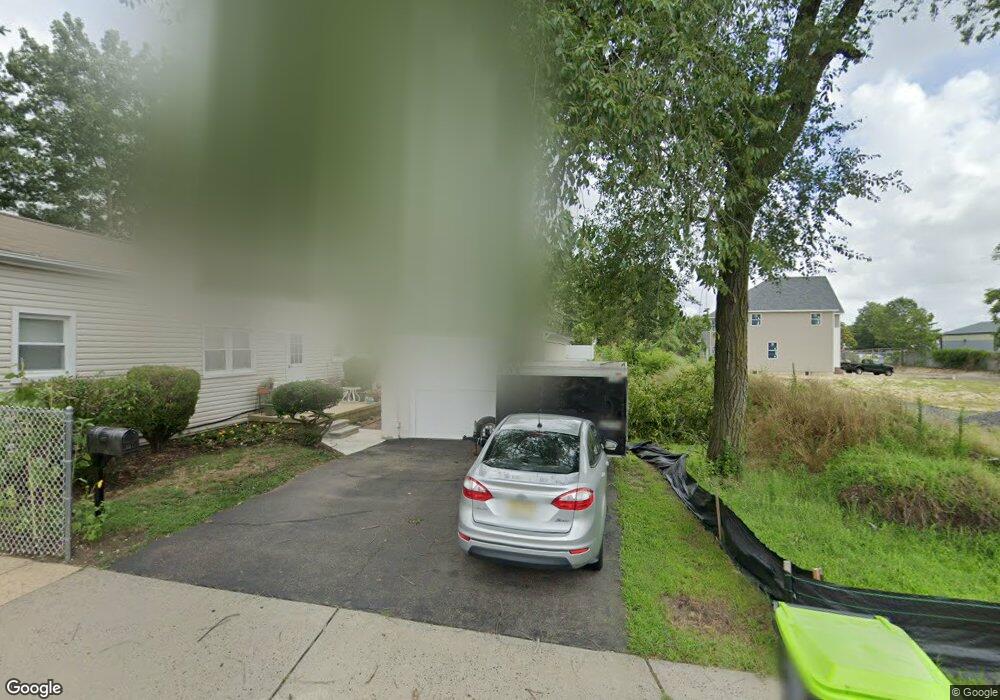
407 Middle Rd Hazlet, NJ 07730
Estimated Value: $344,000 - $530,000
2
Beds
1
Bath
870
Sq Ft
$492/Sq Ft
Est. Value
About This Home
This home is located at 407 Middle Rd, Hazlet, NJ 07730 and is currently estimated at $428,028, approximately $491 per square foot. 407 Middle Rd is a home located in Monmouth County with nearby schools including Raritan High School and Baytul-Iman Academy.
Ownership History
Date
Name
Owned For
Owner Type
Purchase Details
Closed on
Oct 6, 2022
Sold by
Nappi John A and Nappi Helena
Bought by
Cole I Trust and Cole Ii Trust
Current Estimated Value
Purchase Details
Closed on
Feb 19, 2015
Sold by
Nappi John A
Bought by
Nappi John and Nappi Helena
Home Financials for this Owner
Home Financials are based on the most recent Mortgage that was taken out on this home.
Original Mortgage
$120,000
Interest Rate
3.77%
Mortgage Type
New Conventional
Create a Home Valuation Report for This Property
The Home Valuation Report is an in-depth analysis detailing your home's value as well as a comparison with similar homes in the area
Home Values in the Area
Average Home Value in this Area
Purchase History
| Date | Buyer | Sale Price | Title Company |
|---|---|---|---|
| Cole I Trust | -- | -- | |
| Cole I Trust | -- | None Listed On Document | |
| Nappi John | $152,263 | None Available |
Source: Public Records
Mortgage History
| Date | Status | Borrower | Loan Amount |
|---|---|---|---|
| Previous Owner | Nappi John | $120,000 |
Source: Public Records
Tax History Compared to Growth
Tax History
| Year | Tax Paid | Tax Assessment Tax Assessment Total Assessment is a certain percentage of the fair market value that is determined by local assessors to be the total taxable value of land and additions on the property. | Land | Improvement |
|---|---|---|---|---|
| 2025 | $6,917 | $350,100 | $274,900 | $75,200 |
| 2024 | $6,631 | $328,900 | $250,900 | $78,000 |
| 2023 | $6,631 | $310,300 | $232,900 | $77,400 |
| 2022 | $5,579 | $242,000 | $173,900 | $68,100 |
| 2021 | $5,579 | $217,500 | $156,900 | $60,600 |
| 2020 | $5,425 | $210,100 | $150,900 | $59,200 |
| 2019 | $5,162 | $196,800 | $137,900 | $58,900 |
| 2018 | $5,076 | $191,900 | $134,900 | $57,000 |
| 2017 | $4,843 | $183,100 | $127,900 | $55,200 |
| 2016 | $4,788 | $181,700 | $127,900 | $53,800 |
| 2015 | $4,610 | $175,400 | $122,900 | $52,500 |
| 2014 | $4,455 | $167,900 | $117,900 | $50,000 |
Source: Public Records
Map
Nearby Homes
- 64 Hawthorne Ave
- 6 Ridge Dr
- 51 Angela Cir
- 8 Leocadia Ct
- 3 Lisa Dr
- 9 Borick Ave
- 53 Lafayette Dr
- 22 Weller Place Unit 22
- 44 Stanford Dr
- 1 Oxford Rd Unit 34A
- 58 Agostina Dr Unit 250
- 35 Violet Ct
- 32 Bristel Rd Unit 212
- 64 Agostina Dr Unit 64
- 53 Agostina Dr
- 12 Creek Rd
- 26 Nevada Dr
- 82 Agostina Dr
- 8 Stagecoach Dr Unit 13
- 58 Freesia Ct