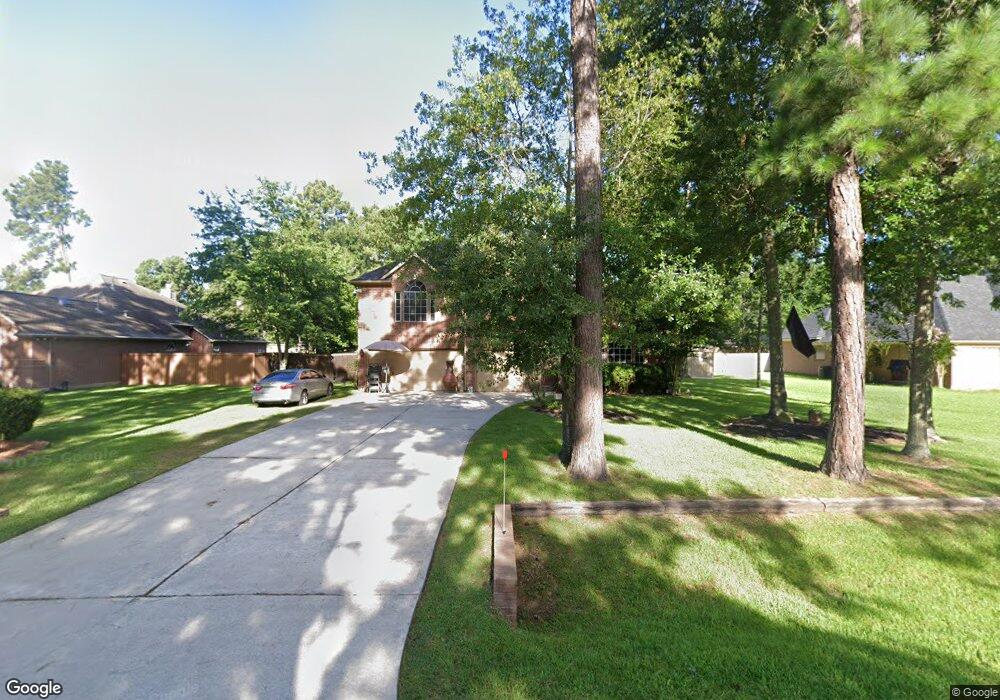
407 Monarch Oak Dr Magnolia, TX 77354
Westwood NeighborhoodEstimated Value: $468,000 - $529,000
4
Beds
3
Baths
2,692
Sq Ft
$187/Sq Ft
Est. Value
About This Home
This home is located at 407 Monarch Oak Dr, Magnolia, TX 77354 and is currently estimated at $504,350, approximately $187 per square foot. 407 Monarch Oak Dr is a home located in Montgomery County with nearby schools including Tom R. Ellisor Elementary School, Bear Branch Junior High School, and Magnolia High School.
Ownership History
Date
Name
Owned For
Owner Type
Purchase Details
Closed on
Jan 17, 2014
Sold by
Thornton David R and Thornton Gayle D
Bought by
Wheless Clinton and Wheless Roxanne
Current Estimated Value
Home Financials for this Owner
Home Financials are based on the most recent Mortgage that was taken out on this home.
Original Mortgage
$264,100
Outstanding Balance
$198,305
Interest Rate
4.25%
Mortgage Type
FHA
Estimated Equity
$306,045
Purchase Details
Closed on
Nov 15, 2002
Sold by
Supreme Builders Ltd
Bought by
Thornton David R and Thornton Gayle D
Home Financials for this Owner
Home Financials are based on the most recent Mortgage that was taken out on this home.
Original Mortgage
$134,550
Interest Rate
5.89%
Purchase Details
Closed on
Jul 11, 2002
Sold by
Lin Bin Hwang
Bought by
Wheless Clinton and Wheless Roxanne
Purchase Details
Closed on
May 15, 2001
Sold by
Lin Bin Hwang and Lin Hsueh Erh
Bought by
Hudson Mike
Create a Home Valuation Report for This Property
The Home Valuation Report is an in-depth analysis detailing your home's value as well as a comparison with similar homes in the area
Home Values in the Area
Average Home Value in this Area
Purchase History
| Date | Buyer | Sale Price | Title Company |
|---|---|---|---|
| Wheless Clinton | -- | Stewart Title Of Montgomery | |
| Thornton David R | -- | -- | |
| Wheless Clinton | -- | -- | |
| Hudson Mike | -- | -- |
Source: Public Records
Mortgage History
| Date | Status | Borrower | Loan Amount |
|---|---|---|---|
| Open | Wheless Clinton | $264,100 | |
| Previous Owner | Thornton David R | $134,550 |
Source: Public Records
Tax History Compared to Growth
Tax History
| Year | Tax Paid | Tax Assessment Tax Assessment Total Assessment is a certain percentage of the fair market value that is determined by local assessors to be the total taxable value of land and additions on the property. | Land | Improvement |
|---|---|---|---|---|
| 2025 | $7,110 | $469,980 | $80,000 | $389,980 |
| 2024 | $6,702 | $449,118 | $80,000 | $369,118 |
| 2023 | $6,702 | $424,520 | $80,000 | $344,520 |
| 2022 | $7,484 | $424,140 | $82,650 | $341,490 |
| 2021 | $5,801 | $312,110 | $57,000 | $255,110 |
| 2020 | $5,916 | $292,330 | $57,000 | $235,330 |
| 2019 | $5,800 | $287,980 | $57,000 | $230,980 |
| 2018 | $5,757 | $272,320 | $20,000 | $252,320 |
| 2017 | $5,775 | $272,320 | $20,000 | $252,320 |
| 2016 | $5,532 | $260,860 | $20,000 | $240,860 |
| 2015 | $4,736 | $254,310 | $20,000 | $234,310 |
| 2014 | $4,736 | $230,790 | $20,000 | $210,790 |
Source: Public Records
Map
Nearby Homes
- 502 Garrett Dr
- 5918 Mahogany Way
- 914 Box Elder Dr
- 6107 Cypress Way Dr
- 803 Box Elder Dr
- 5503 Teakwood Ln
- 506 Weeping Willow Way
- 711 Shadberry Dr
- 503 Weisinger Dr
- 906 Weeping Willow Way
- 319 Weisinger Dr
- 902 Mesquite Dr
- 6706 Durango Creek Dr
- 6221 Ranch Lake Dr
- 906 Wiley Dr
- 6718 Durango Creek Dr
- 6422 Sugar Bush Dr
- 33319 Lago Vista
- 81 N Apple Springs Cir
- 6846 Durango Creek Dr
- 403 Monarch Oak Dr
- 410 Garrett Dr
- 402 Garrett Dr
- 0 Monarch Oak Dr
- 406 Monarch Oak Dr
- 5913 Lotus
- 410 Monarch Oak Dr
- 402 Monarch Oak Dr
- 419 Monarch Oak Dr
- 5907 Lotus
- 414 Monarch Oak Dr
- 5903 Lotus
- 5911 Lotus
- 5819 Lotus
- 5915 Lotus
- 418 Monarch Oak Dr
- 503 Monarch Oak Dr
- 5815 Lotus
- 407 Mackintosh Dr
- 403 Garrett Dr