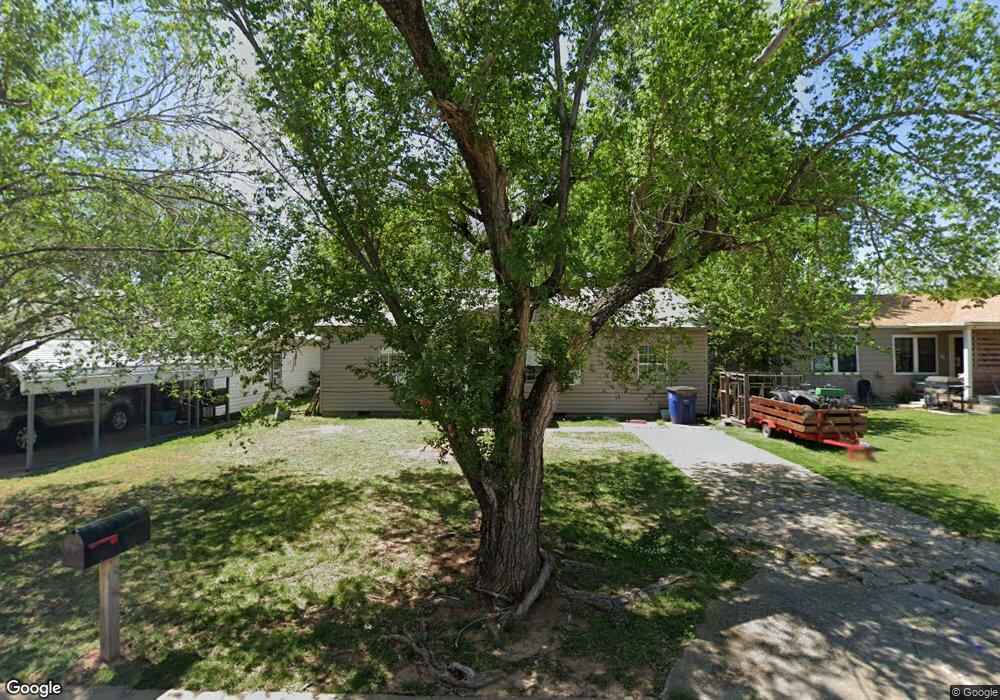
407 N E St Duncan, OK 73533
Estimated Value: $54,301 - $63,000
3
Beds
1
Bath
1,066
Sq Ft
$54/Sq Ft
Est. Value
About This Home
This home is located at 407 N E St, Duncan, OK 73533 and is currently estimated at $57,825, approximately $54 per square foot. 407 N E St is a home located in Stephens County with nearby schools including Woodrow Wilson Elementary School, Duncan Middle School, and Duncan High School.
Ownership History
Date
Name
Owned For
Owner Type
Purchase Details
Closed on
Mar 22, 2018
Sold by
Embree James Ray
Bought by
Price Kord R
Current Estimated Value
Home Financials for this Owner
Home Financials are based on the most recent Mortgage that was taken out on this home.
Original Mortgage
$10,823
Outstanding Balance
$3,058
Interest Rate
4.32%
Mortgage Type
Commercial
Estimated Equity
$54,767
Purchase Details
Closed on
Feb 28, 1996
Sold by
Magnolia Federal Bank
Bought by
Garrison Jean
Purchase Details
Closed on
Dec 21, 1995
Sold by
Davis Duane
Create a Home Valuation Report for This Property
The Home Valuation Report is an in-depth analysis detailing your home's value as well as a comparison with similar homes in the area
Purchase History
| Date | Buyer | Sale Price | Title Company |
|---|---|---|---|
| Price Kord R | $10,000 | Stephens Co Abstract Co | |
| Garrison Jean | $7,500 | -- | |
| -- | -- | -- |
Source: Public Records
Mortgage History
| Date | Status | Borrower | Loan Amount |
|---|---|---|---|
| Open | Price Kord R | $10,823 |
Source: Public Records
Tax History
| Year | Tax Paid | Tax Assessment Tax Assessment Total Assessment is a certain percentage of the fair market value that is determined by local assessors to be the total taxable value of land and additions on the property. | Land | Improvement |
|---|---|---|---|---|
| 2025 | $274 | $3,254 | $303 | $2,951 |
| 2024 | $251 | $2,951 | $303 | $2,648 |
| 2023 | $251 | $2,811 | $303 | $2,508 |
| 2022 | $262 | $3,173 | $303 | $2,870 |
| 2021 | $262 | $3,079 | $303 | $2,776 |
| 2020 | $241 | $2,793 | $303 | $2,490 |
| 2019 | $242 | $2,795 | $303 | $2,492 |
| 2018 | $192 | $2,153 | $303 | $1,850 |
| 2017 | $192 | $2,234 | $303 | $1,931 |
| 2016 | $234 | $2,750 | $303 | $2,447 |
| 2015 | $229 | $2,750 | $303 | $2,447 |
| 2014 | $229 | $2,888 | $355 | $2,533 |
Source: Public Records
Map
Nearby Homes
Your Personal Tour Guide
Ask me questions while you tour the home.